
Worksheets
Using GeniiData, you can query blockchain data using SQL, and the results can be used to create amazing data visualizations using our charts and graphs.
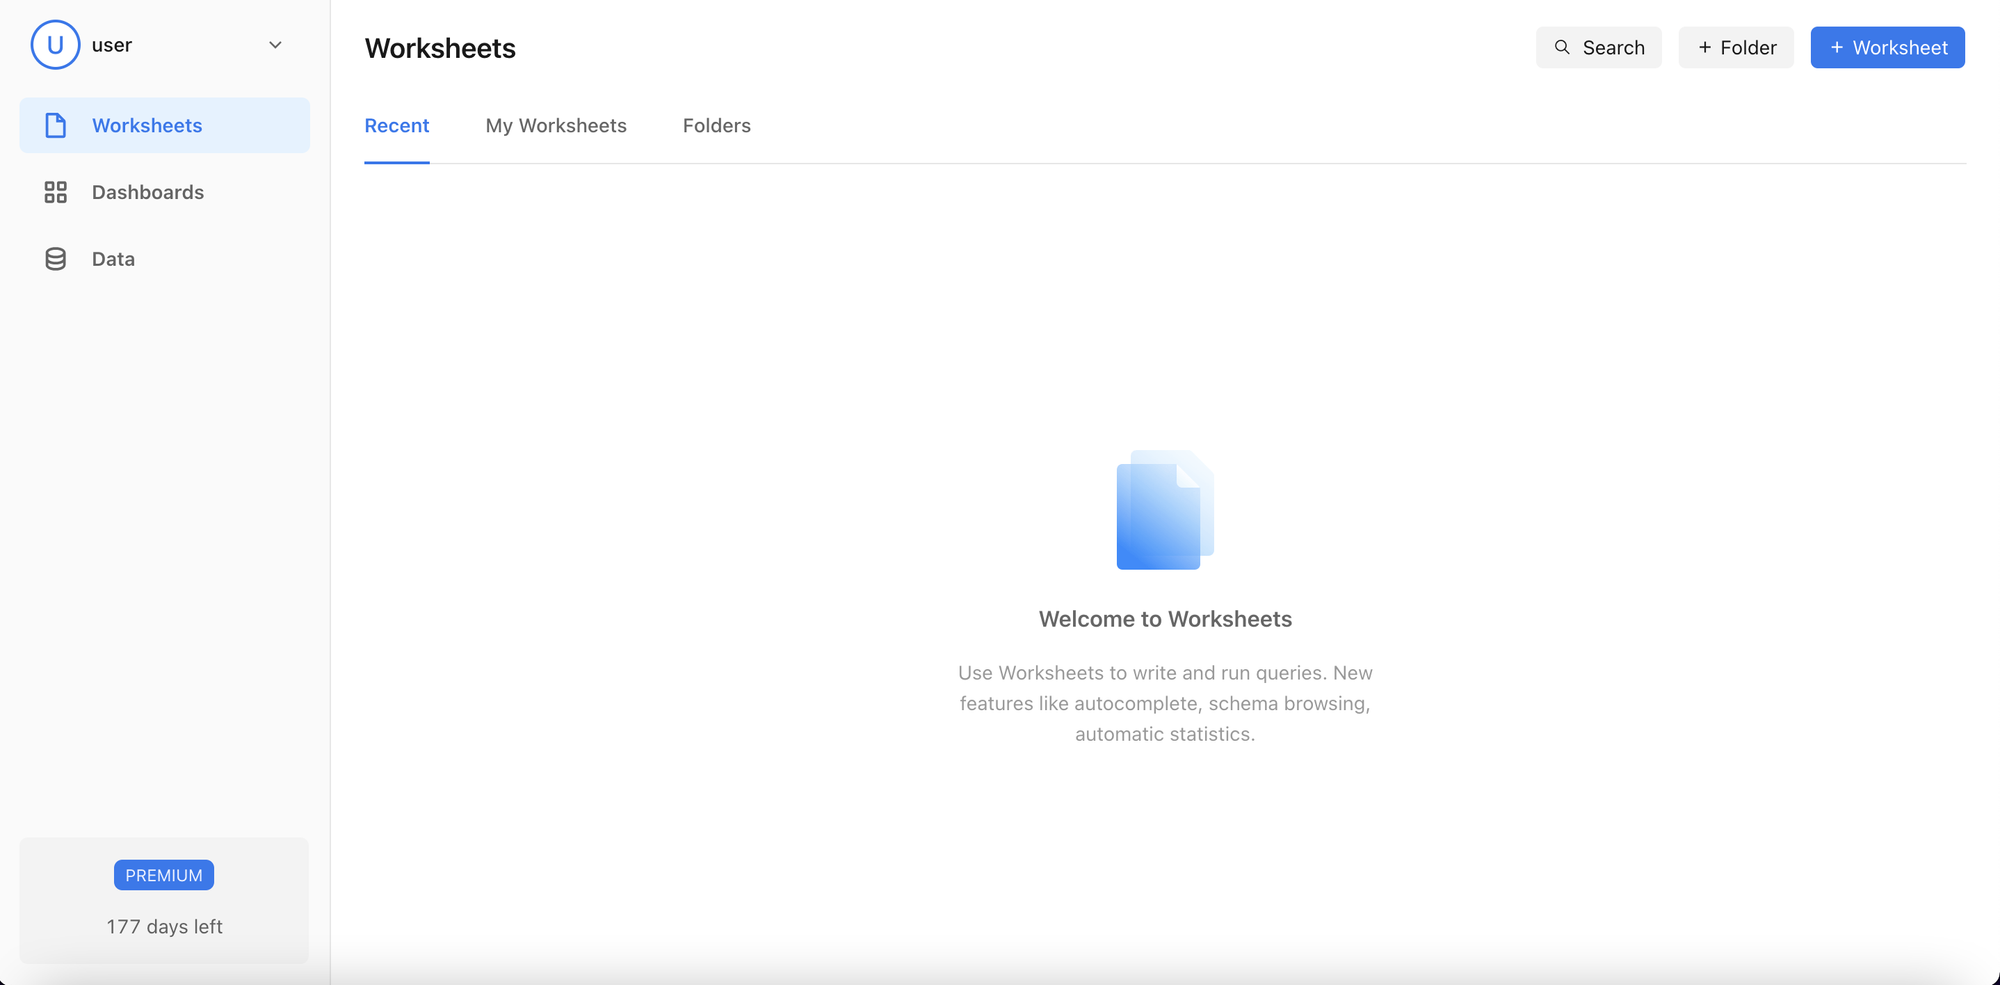
- Recent: Displays recently-viewed Worksheets list
- My Worksheets: Displays all created folders and Worksheets
- Folders: Displays the folder list. Click on 'Folders' to view the embedded Worksheets.
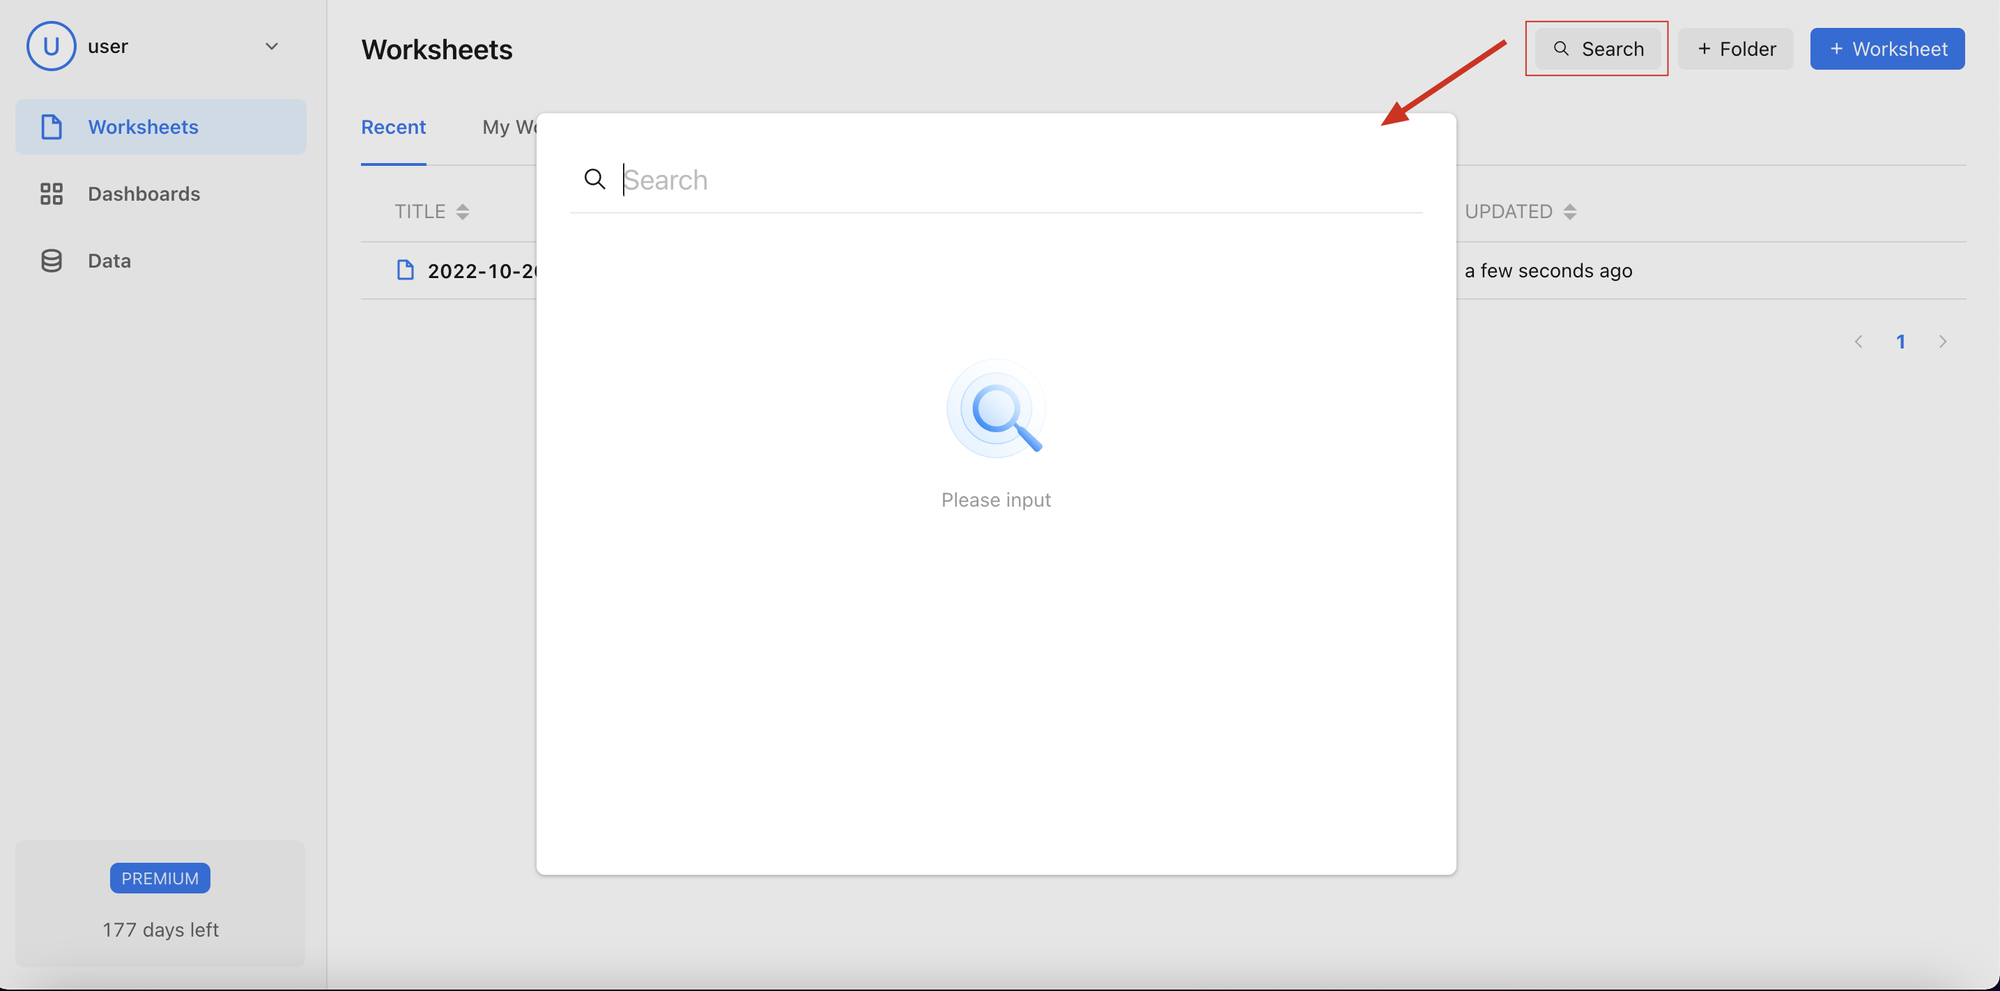
Search
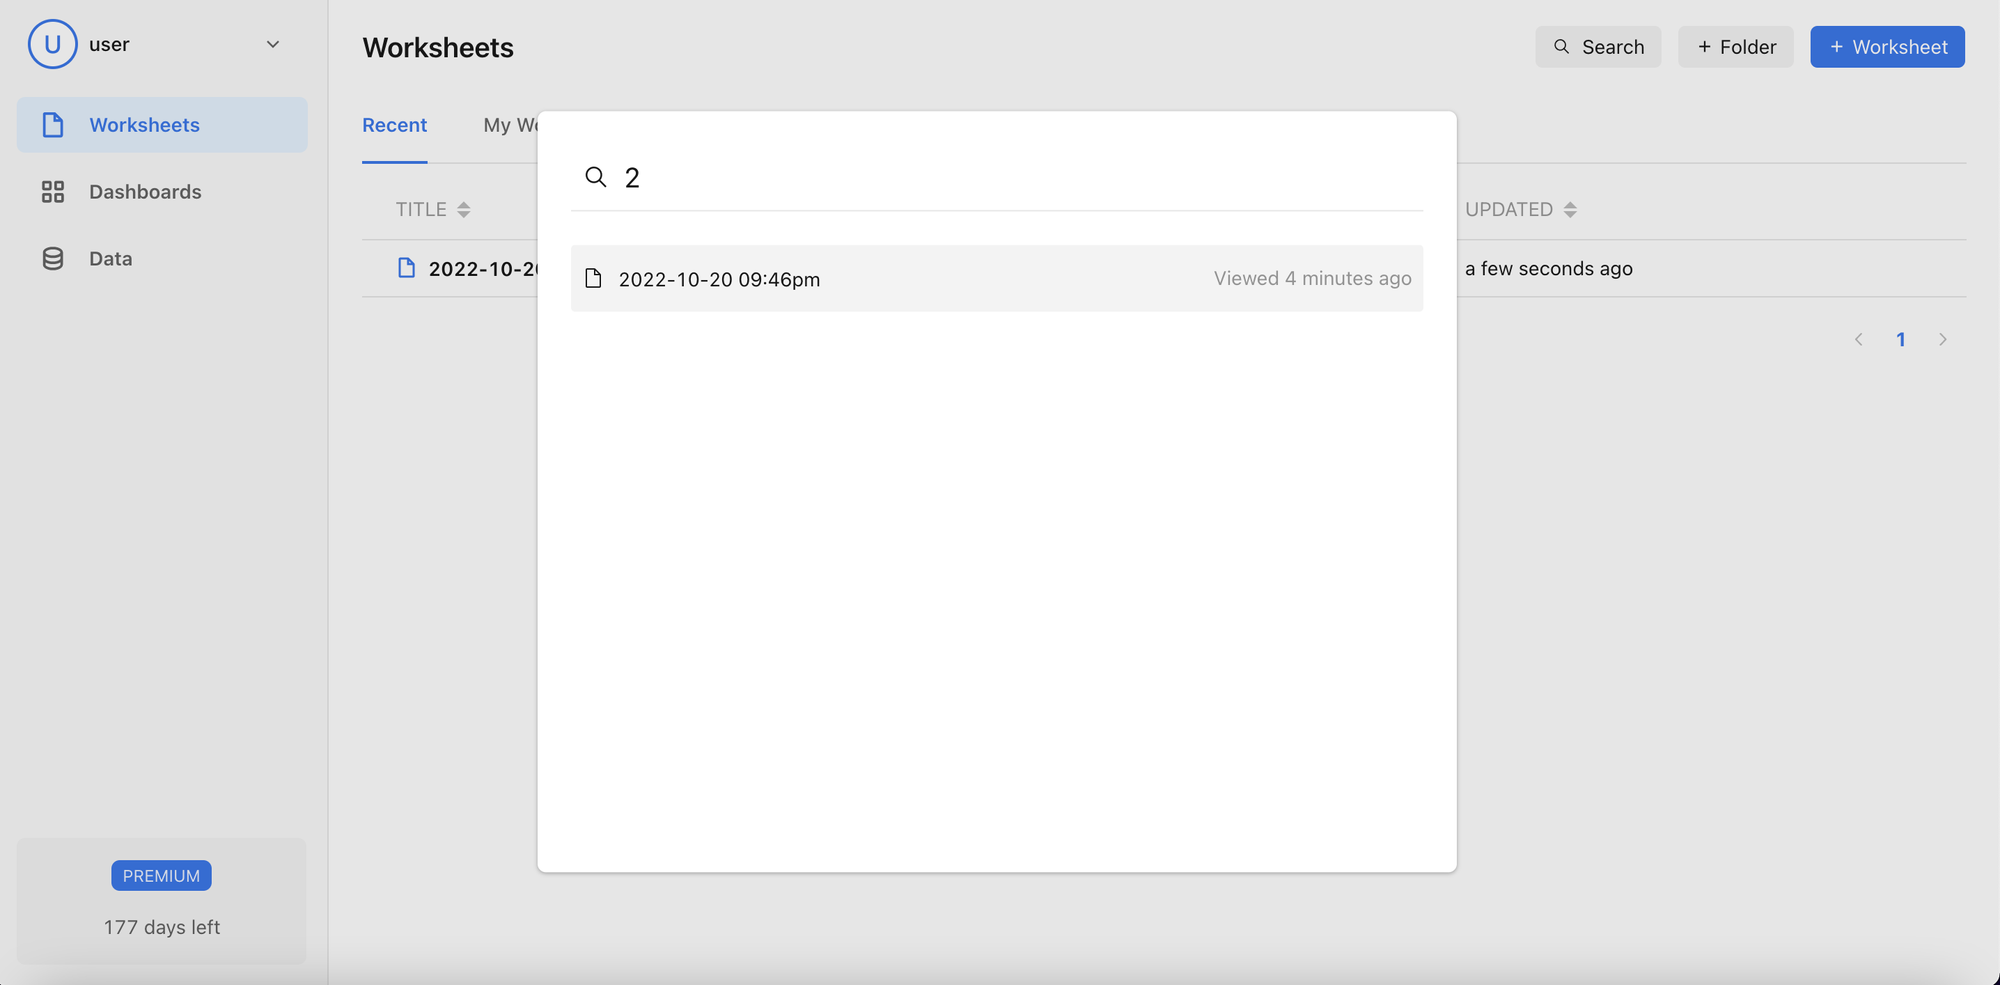
- Click Search to search for Worksheets, Folders, and Dashboard.
- Click the search result to enter the corresponding operation page.
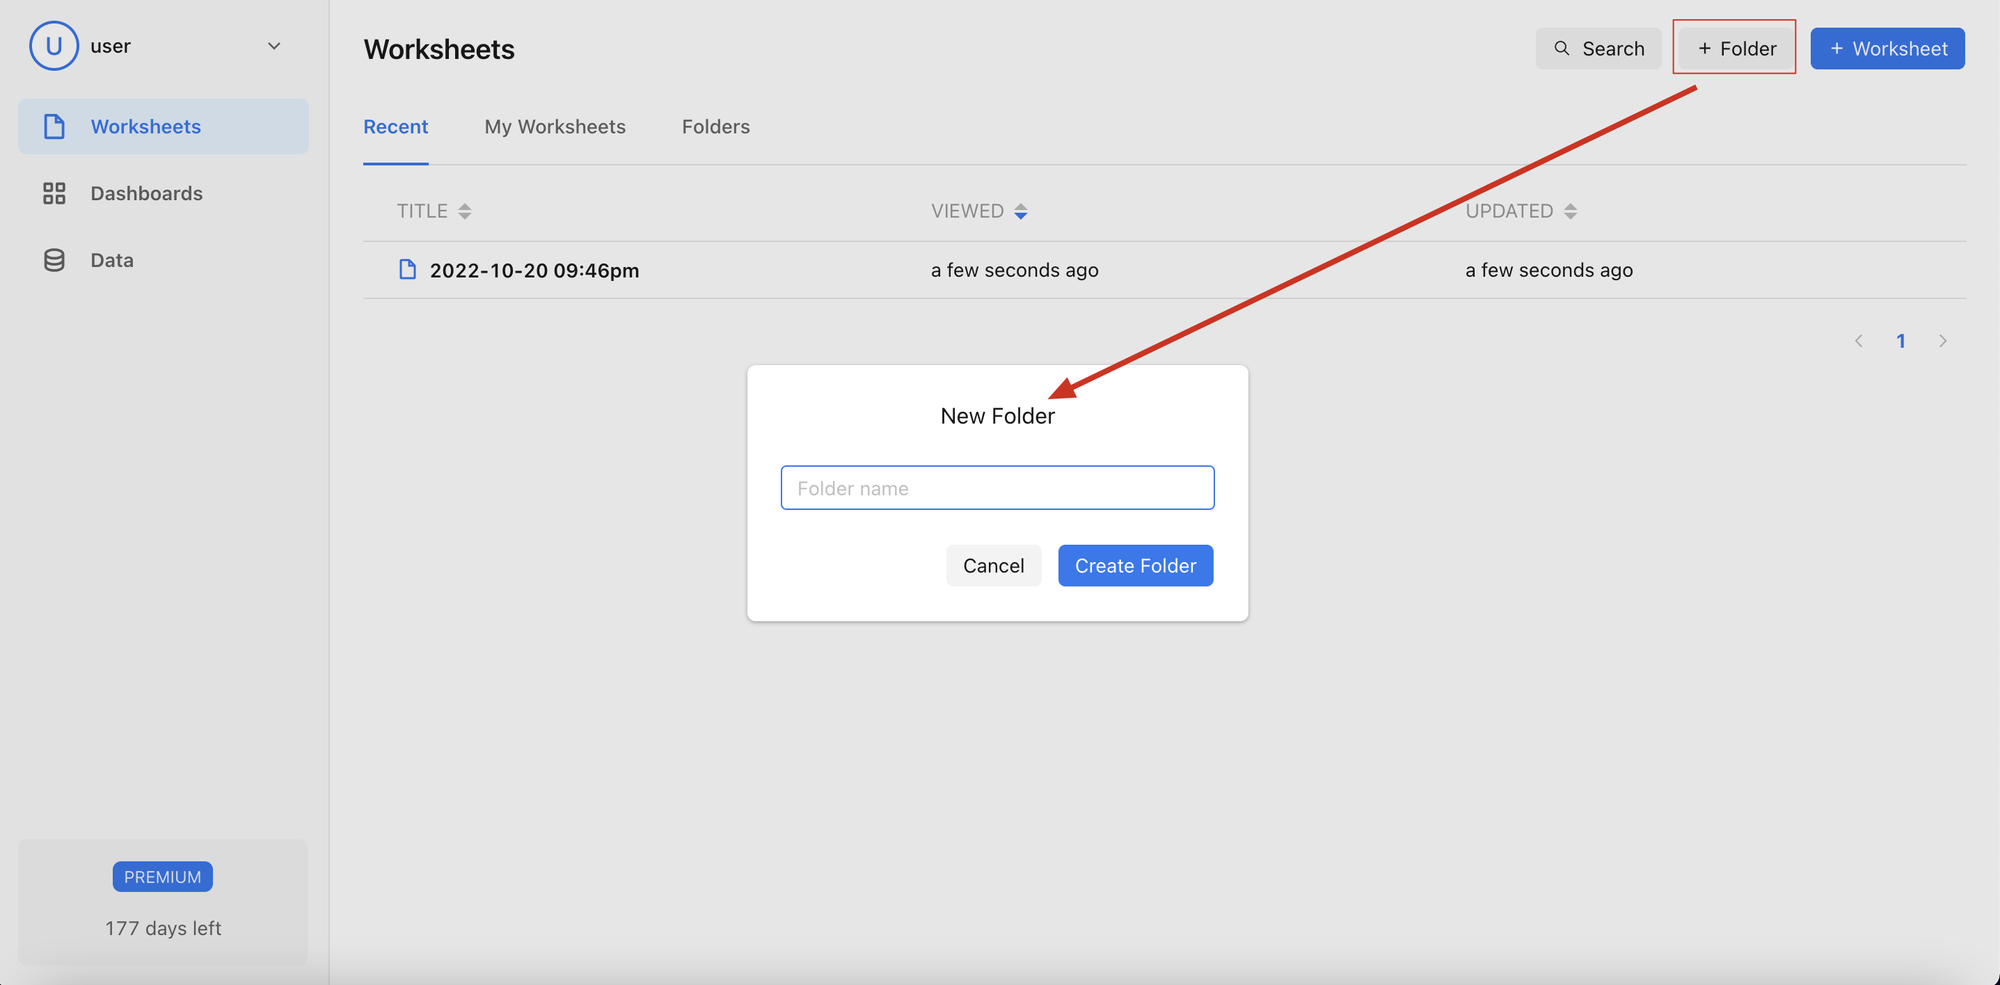
Folders
Add folder
- Click on +Folder, enter the Folder name, and Click Create Folder.
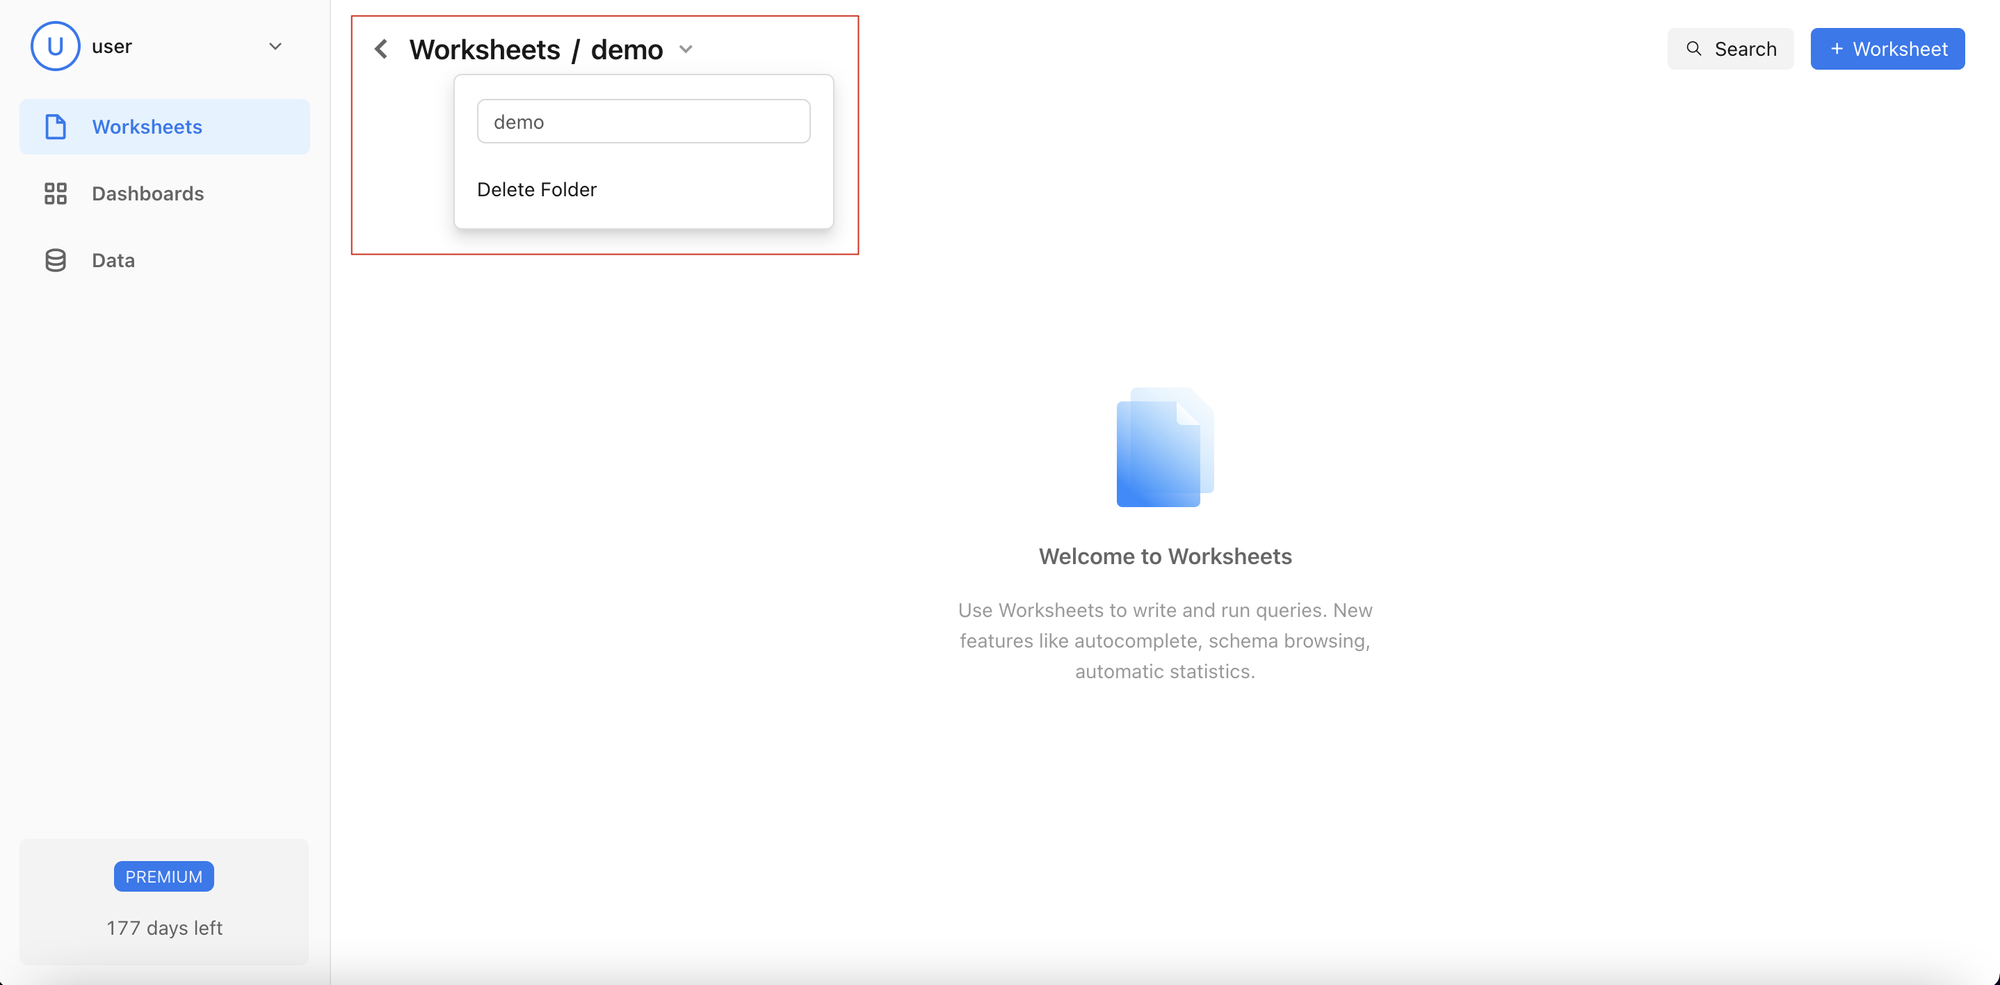
Modify and Delete Folders
- Click the folder name. Users can modify or delete the folder name in the displayed drop-down list.
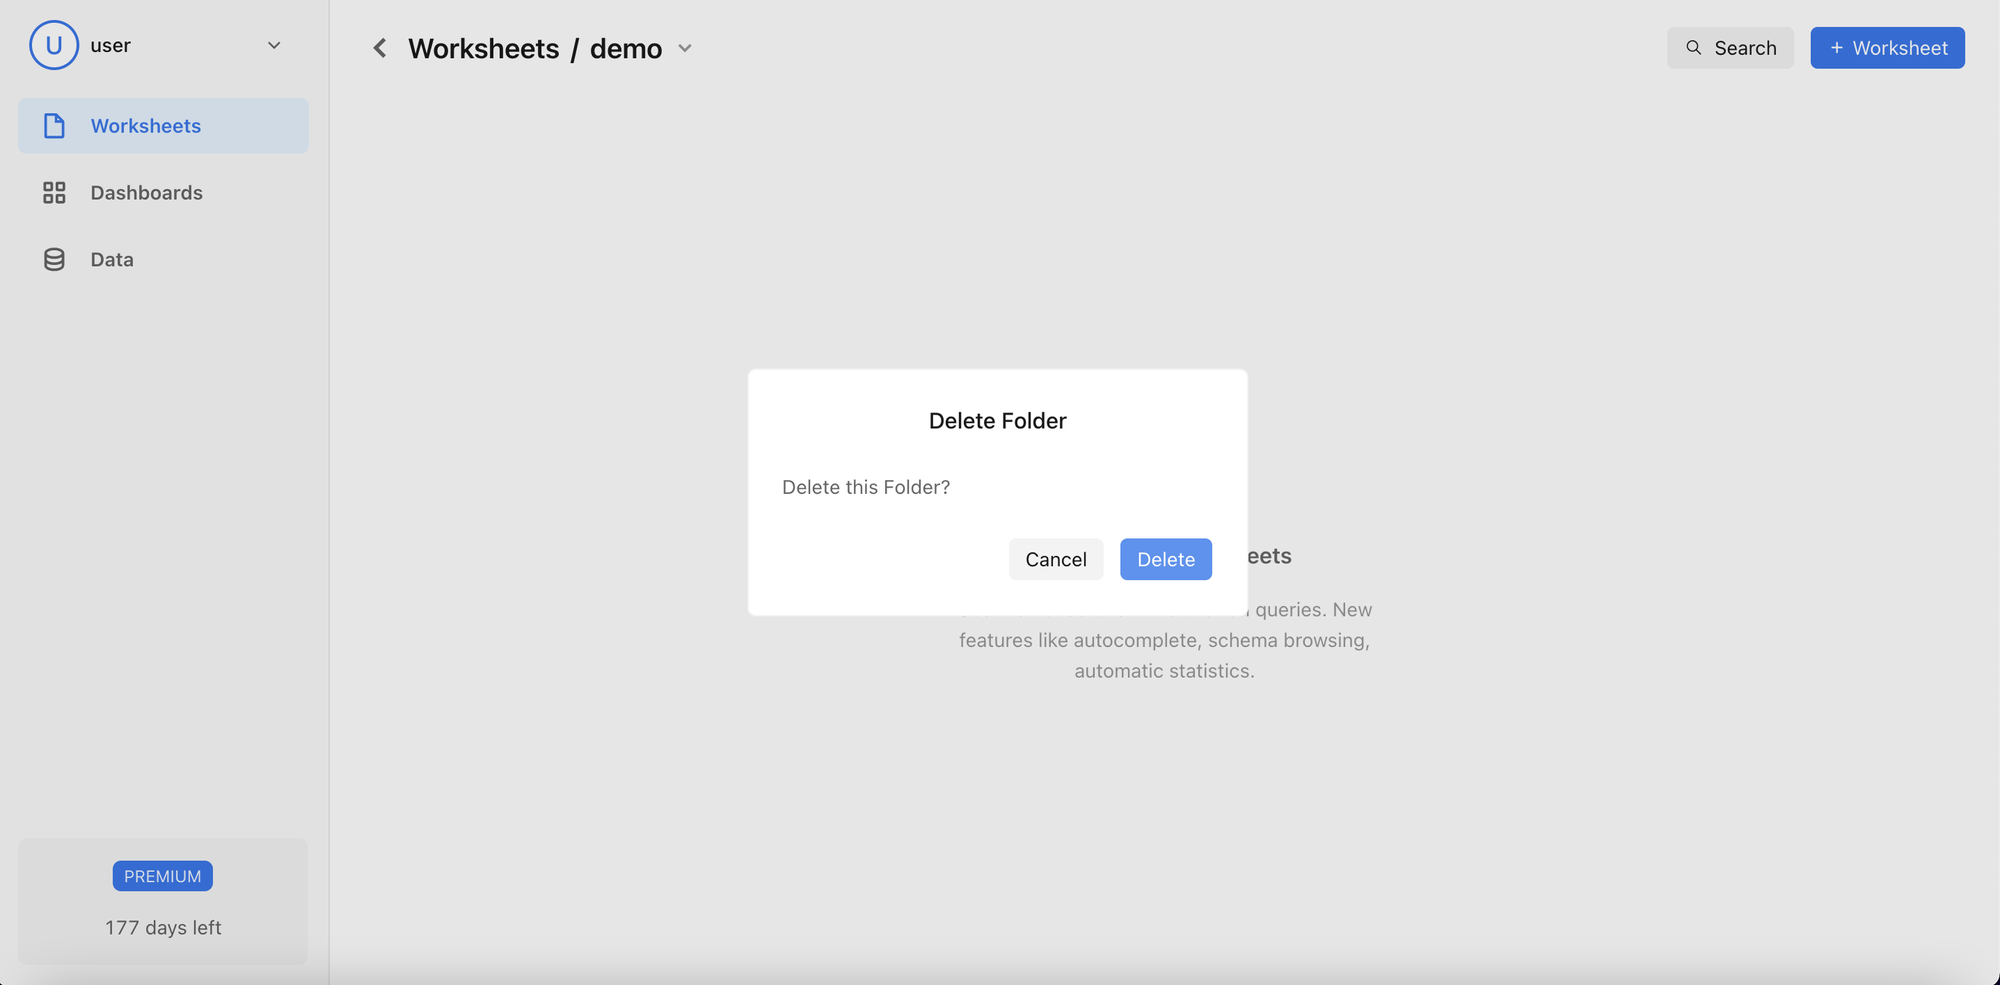
- A double-check is performed when deleting to confirm the action.
- If Delete is selected, the folder is deleted.
- If Cancel is selected, the folder is not deleted, and the pop-up is closed.
Add Worksheets
- Click on +Worksheets to enter the worksheet operation interface.
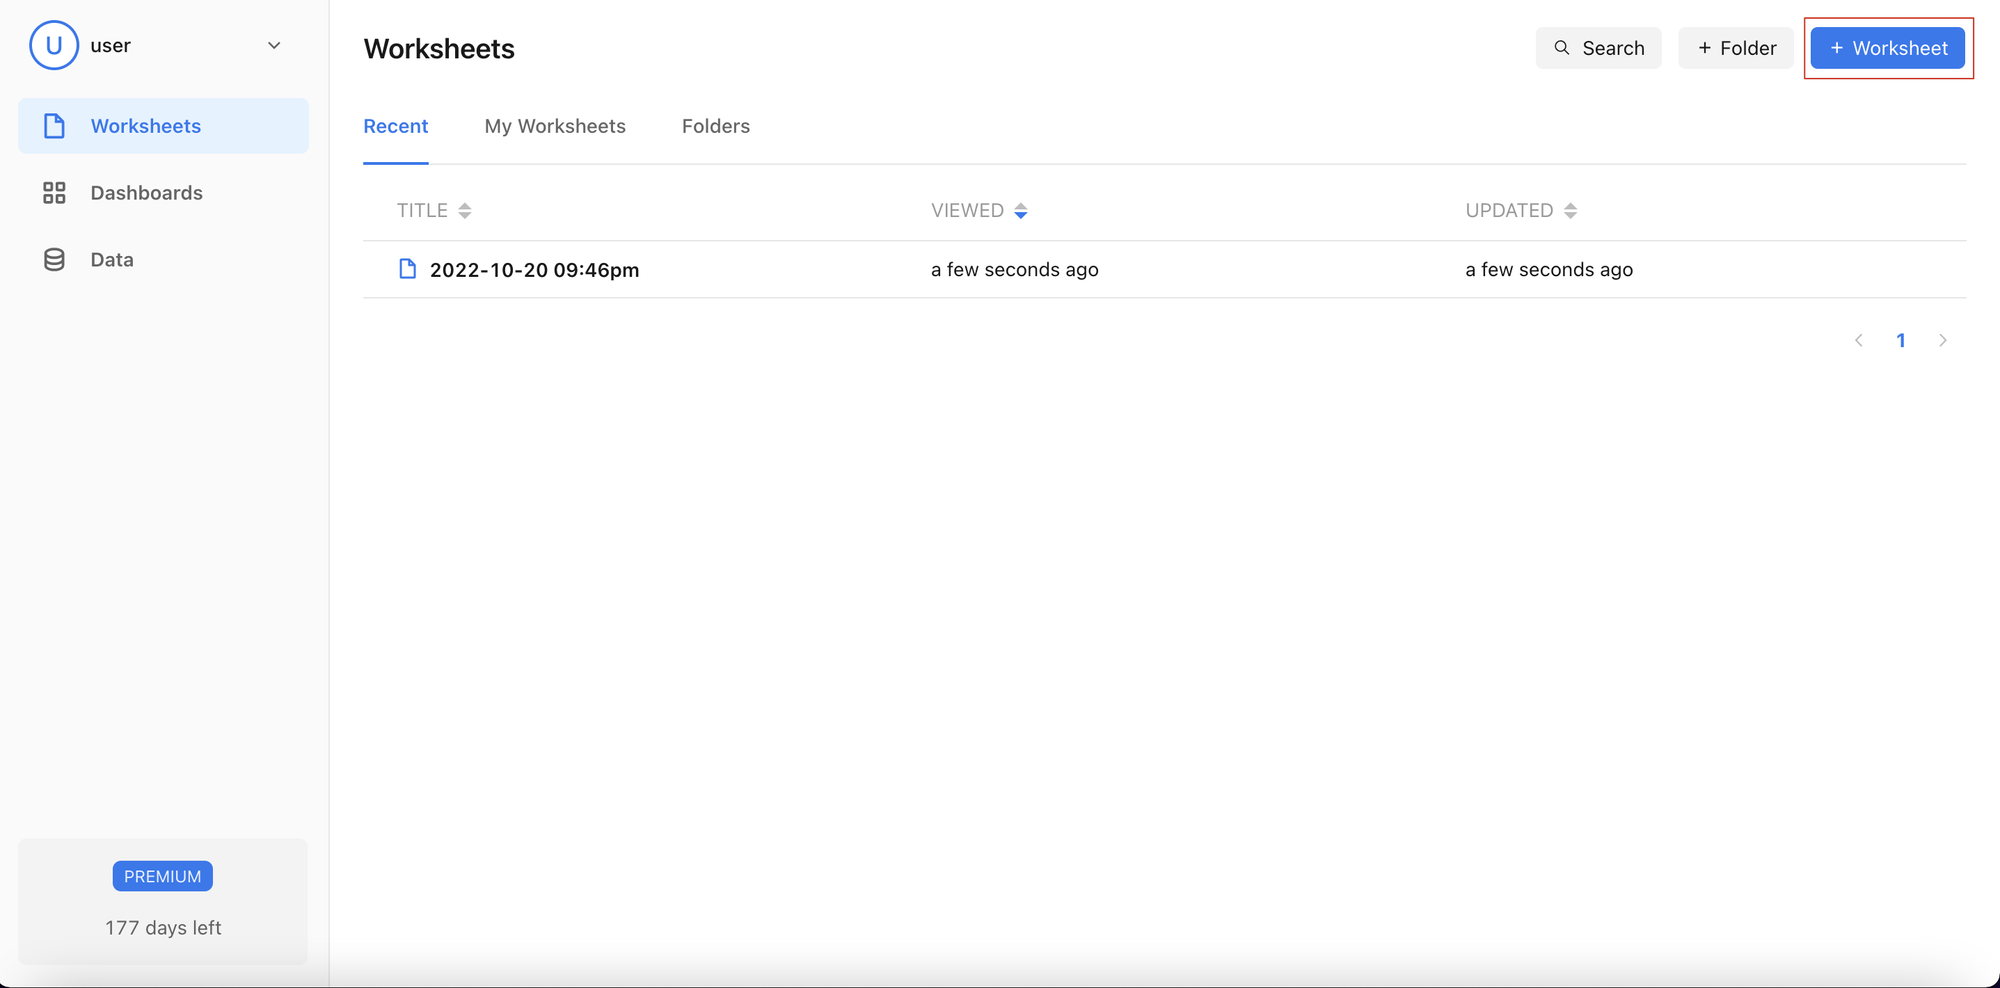
- Worksheets will be split up into four parts
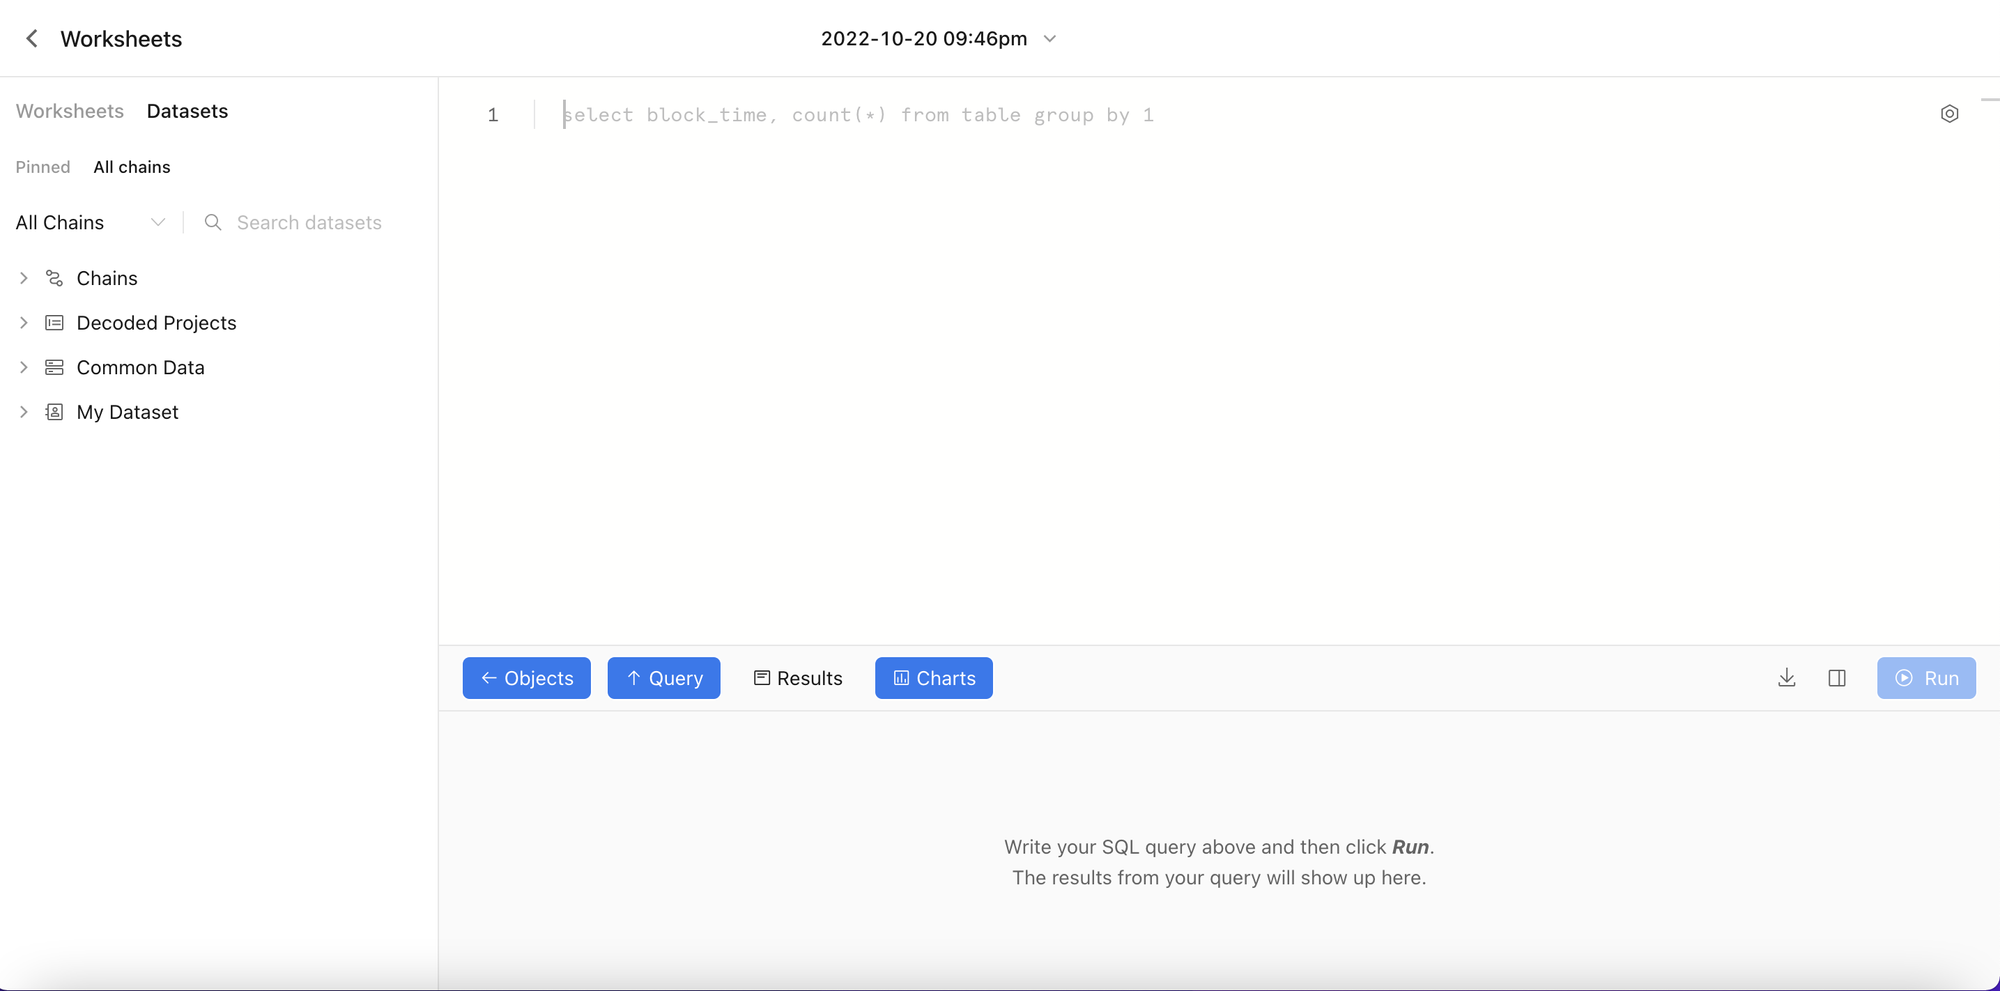
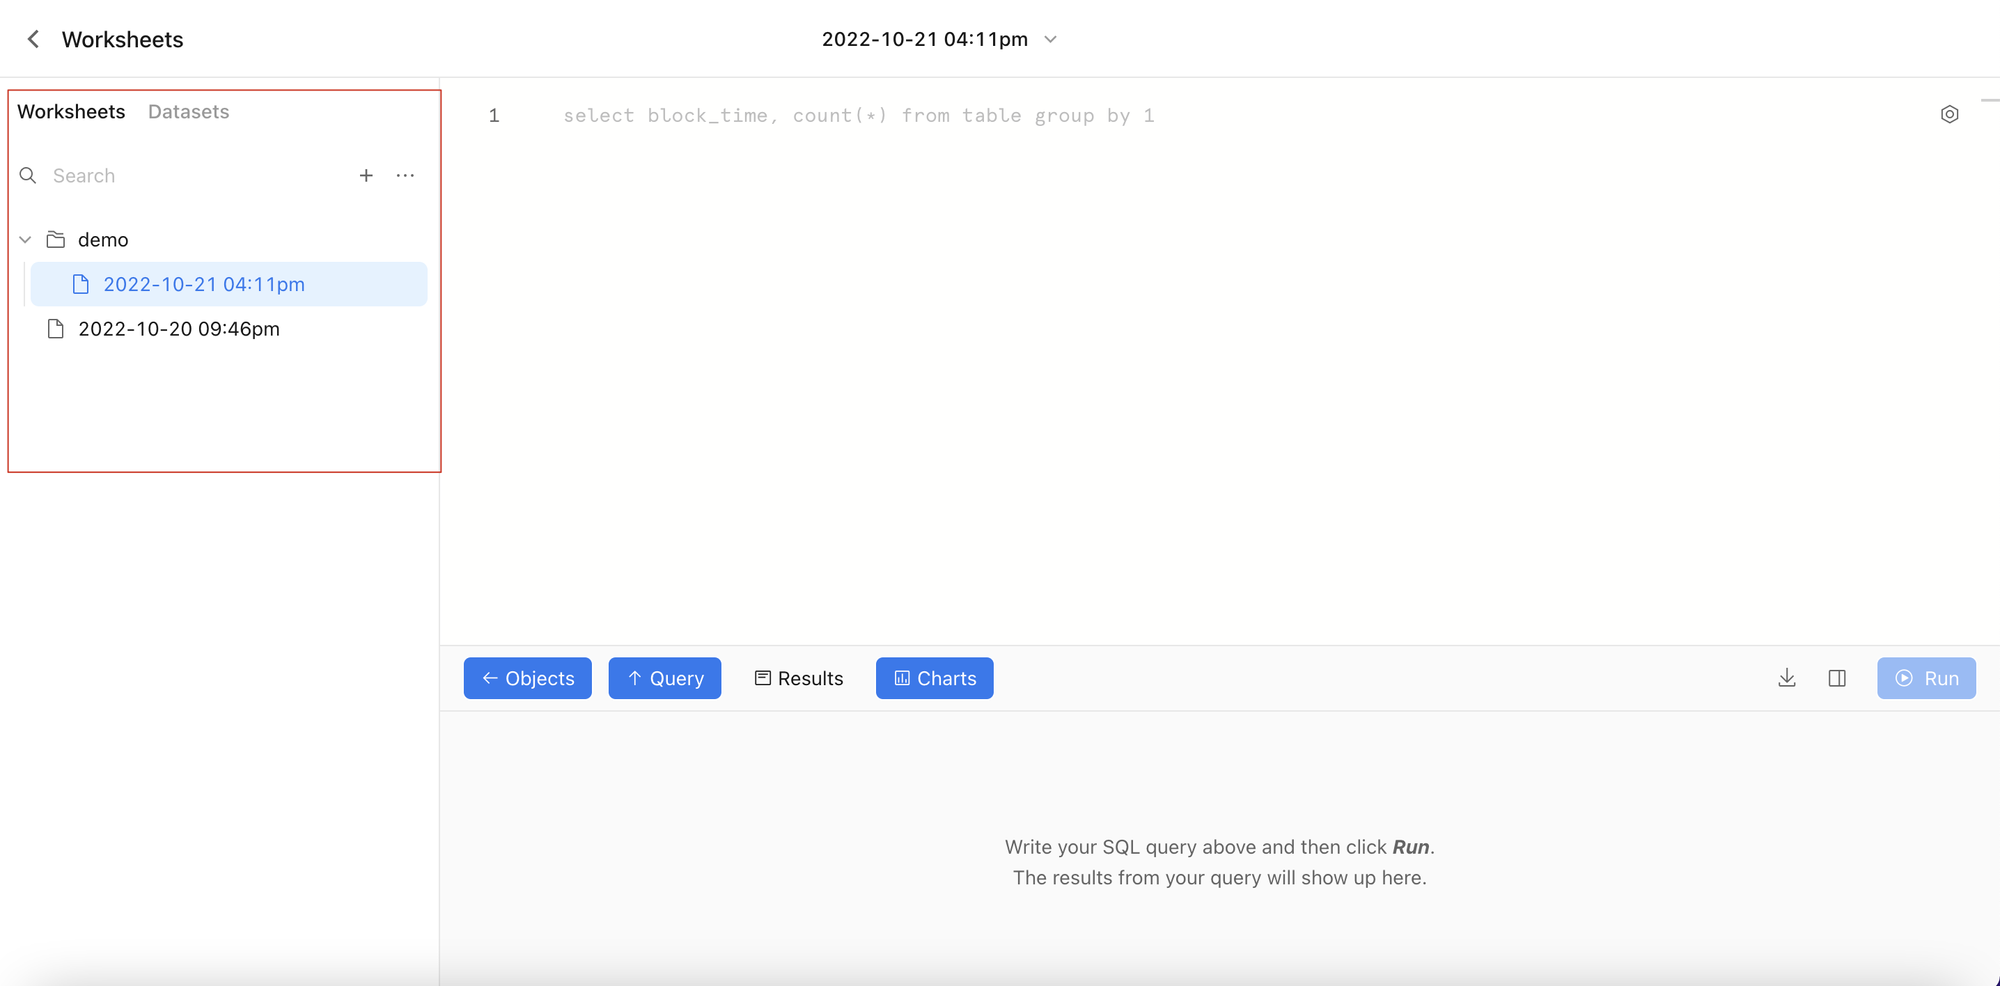
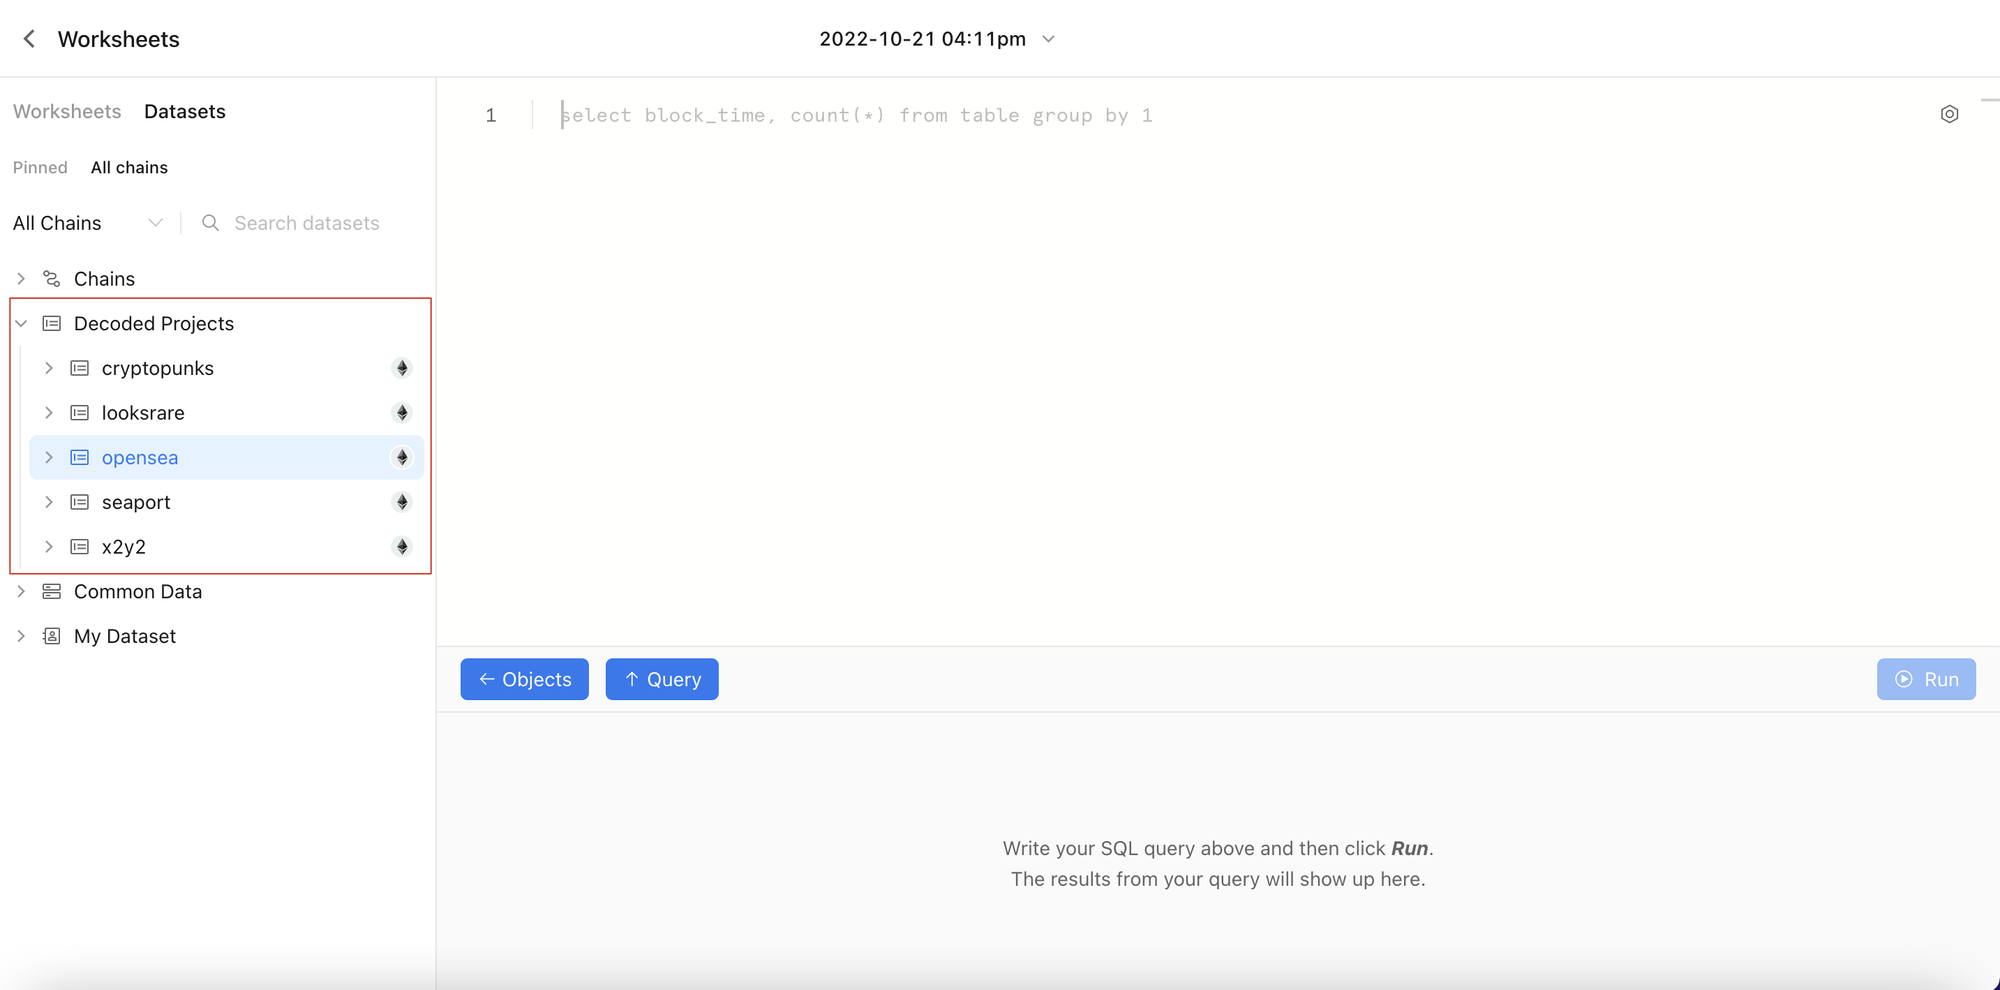
Worksheets and Datasets
- Worksheets
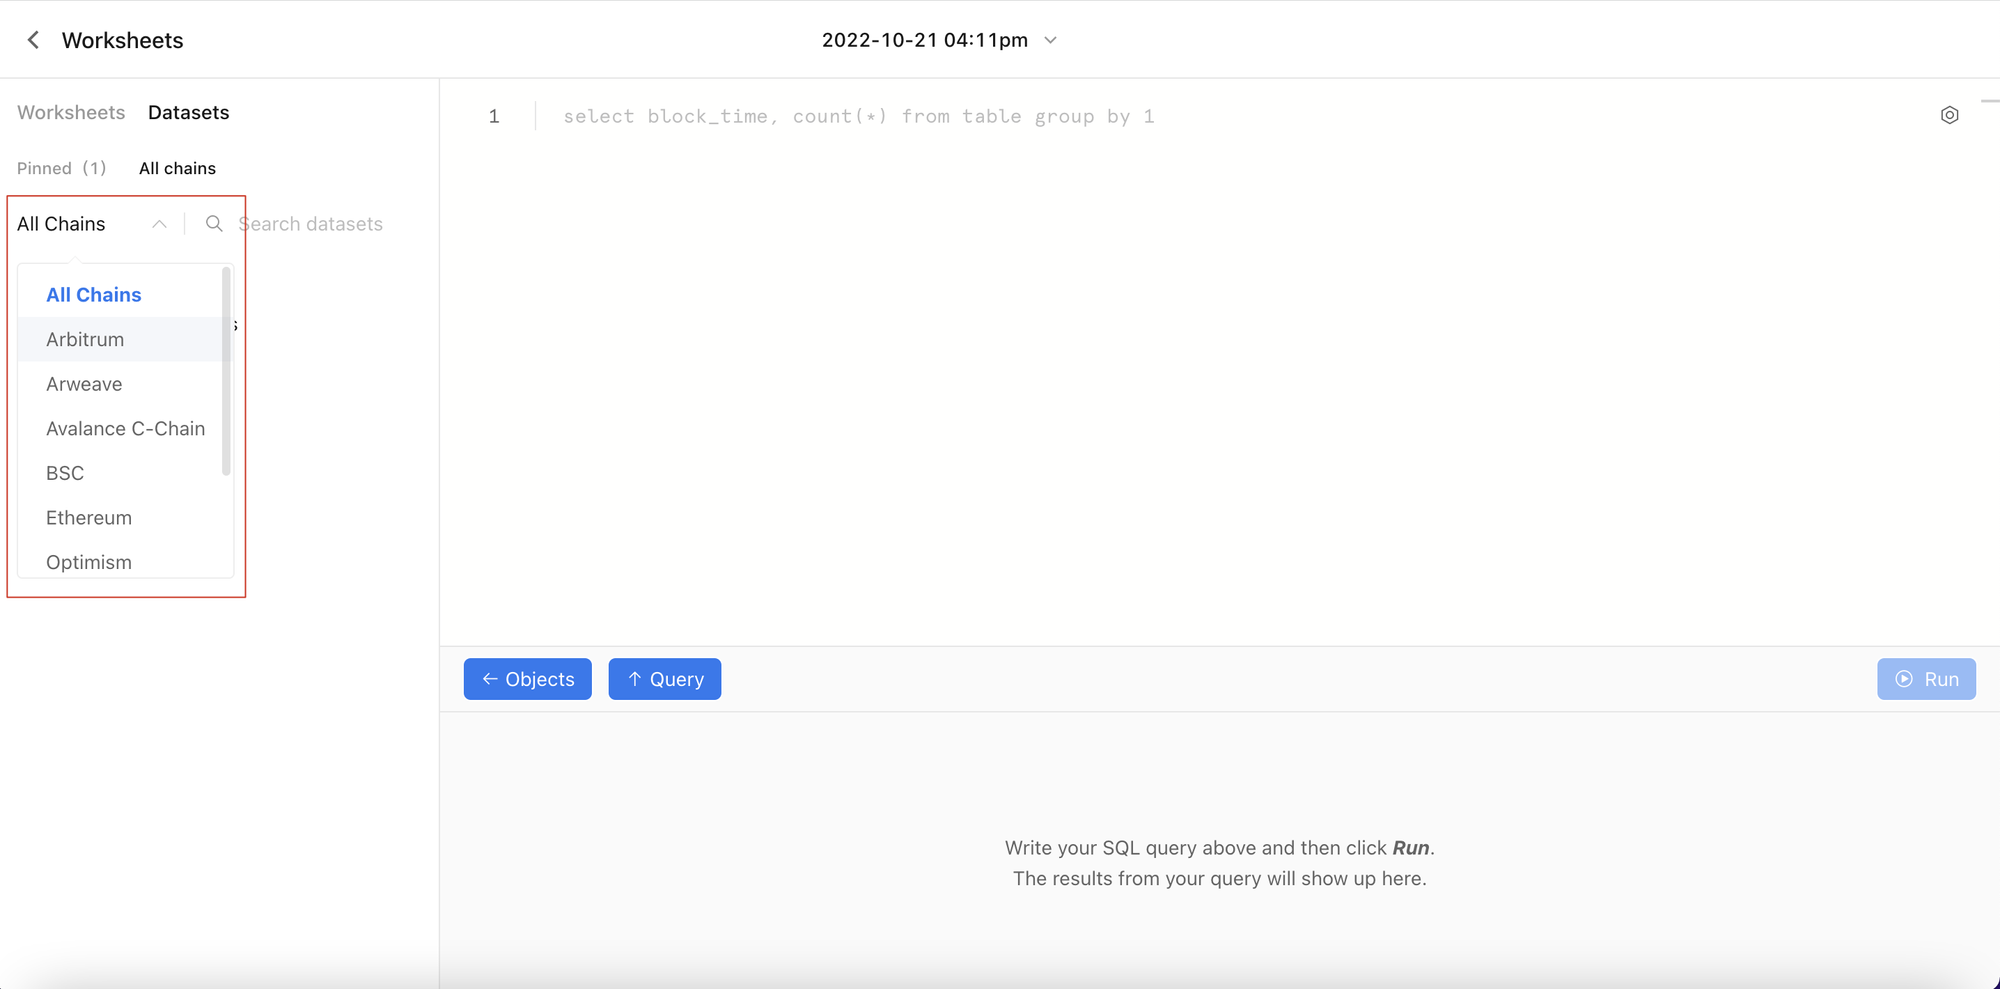
- Datasets
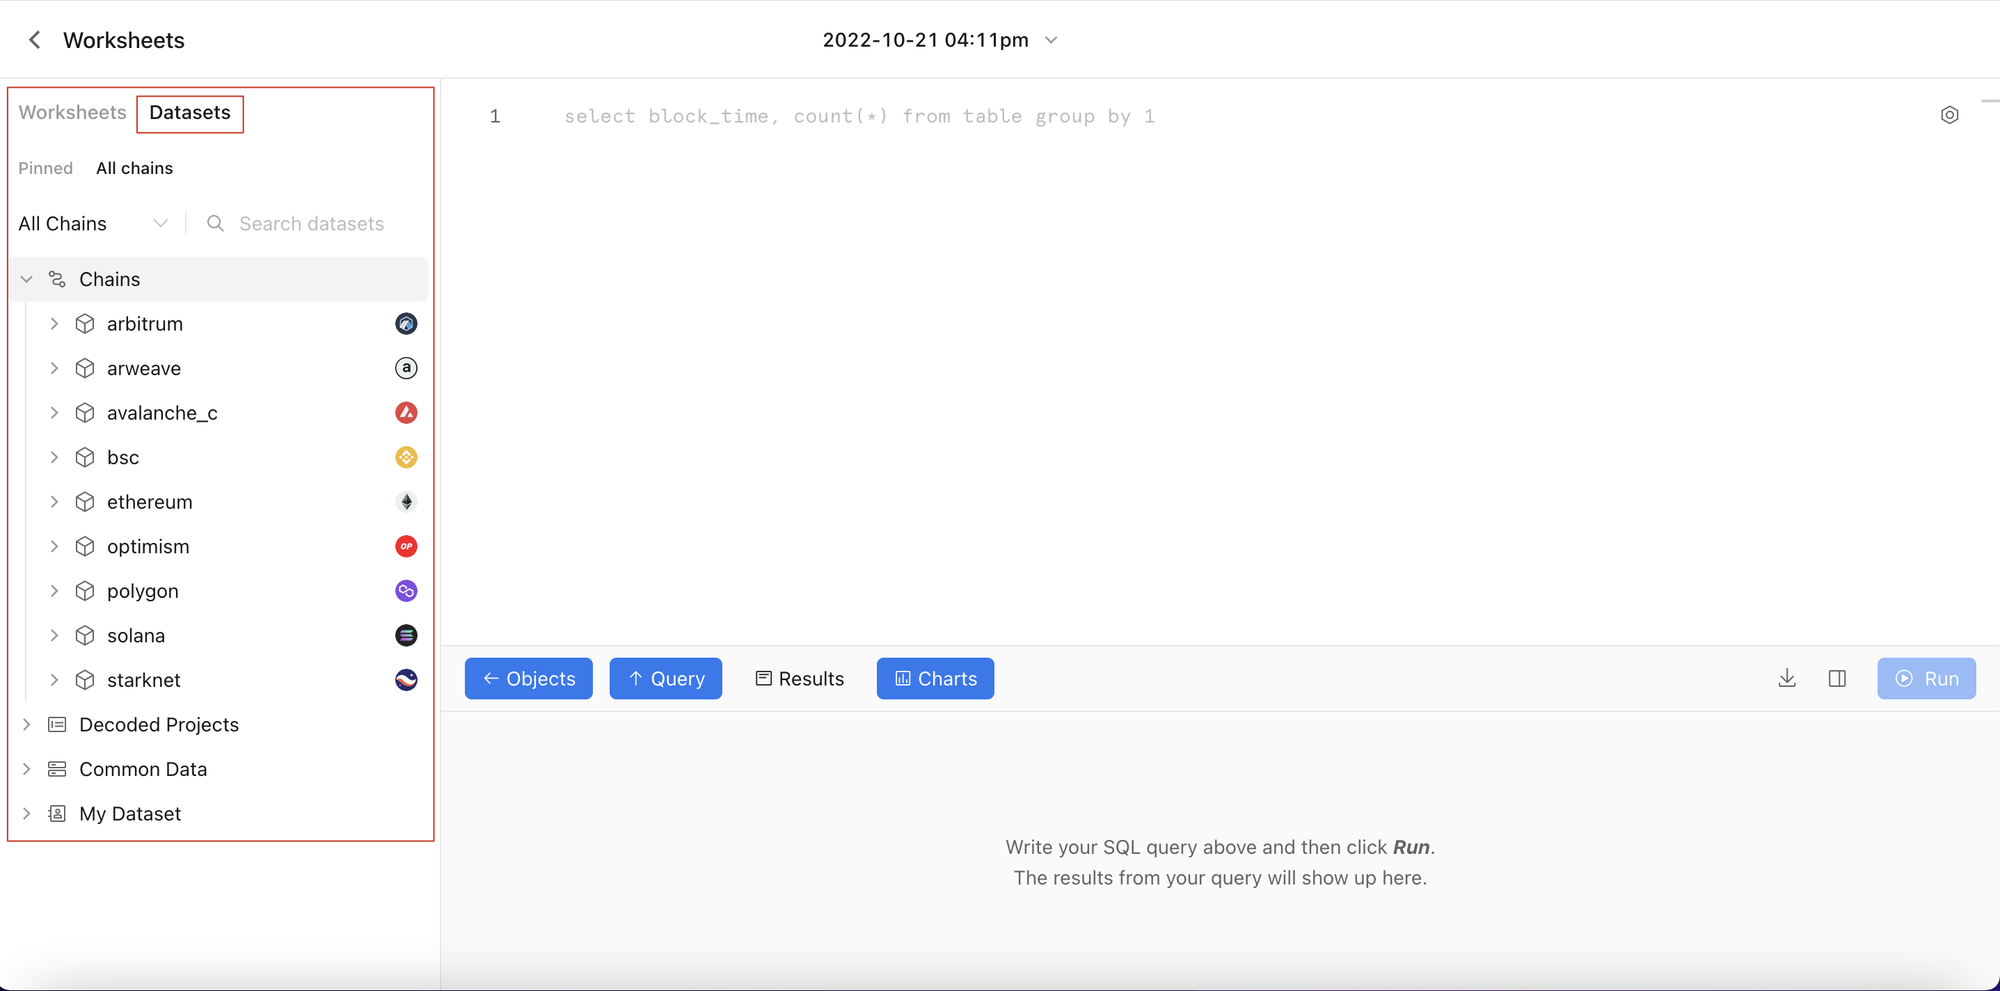
- Currently supported chain networks: https://geniidata.notion.site/Chains-00f257dfd8fa46cb9e0be4b688733b40
- Decoded Projects: Supporting contract data from opensea, x2y2, etc
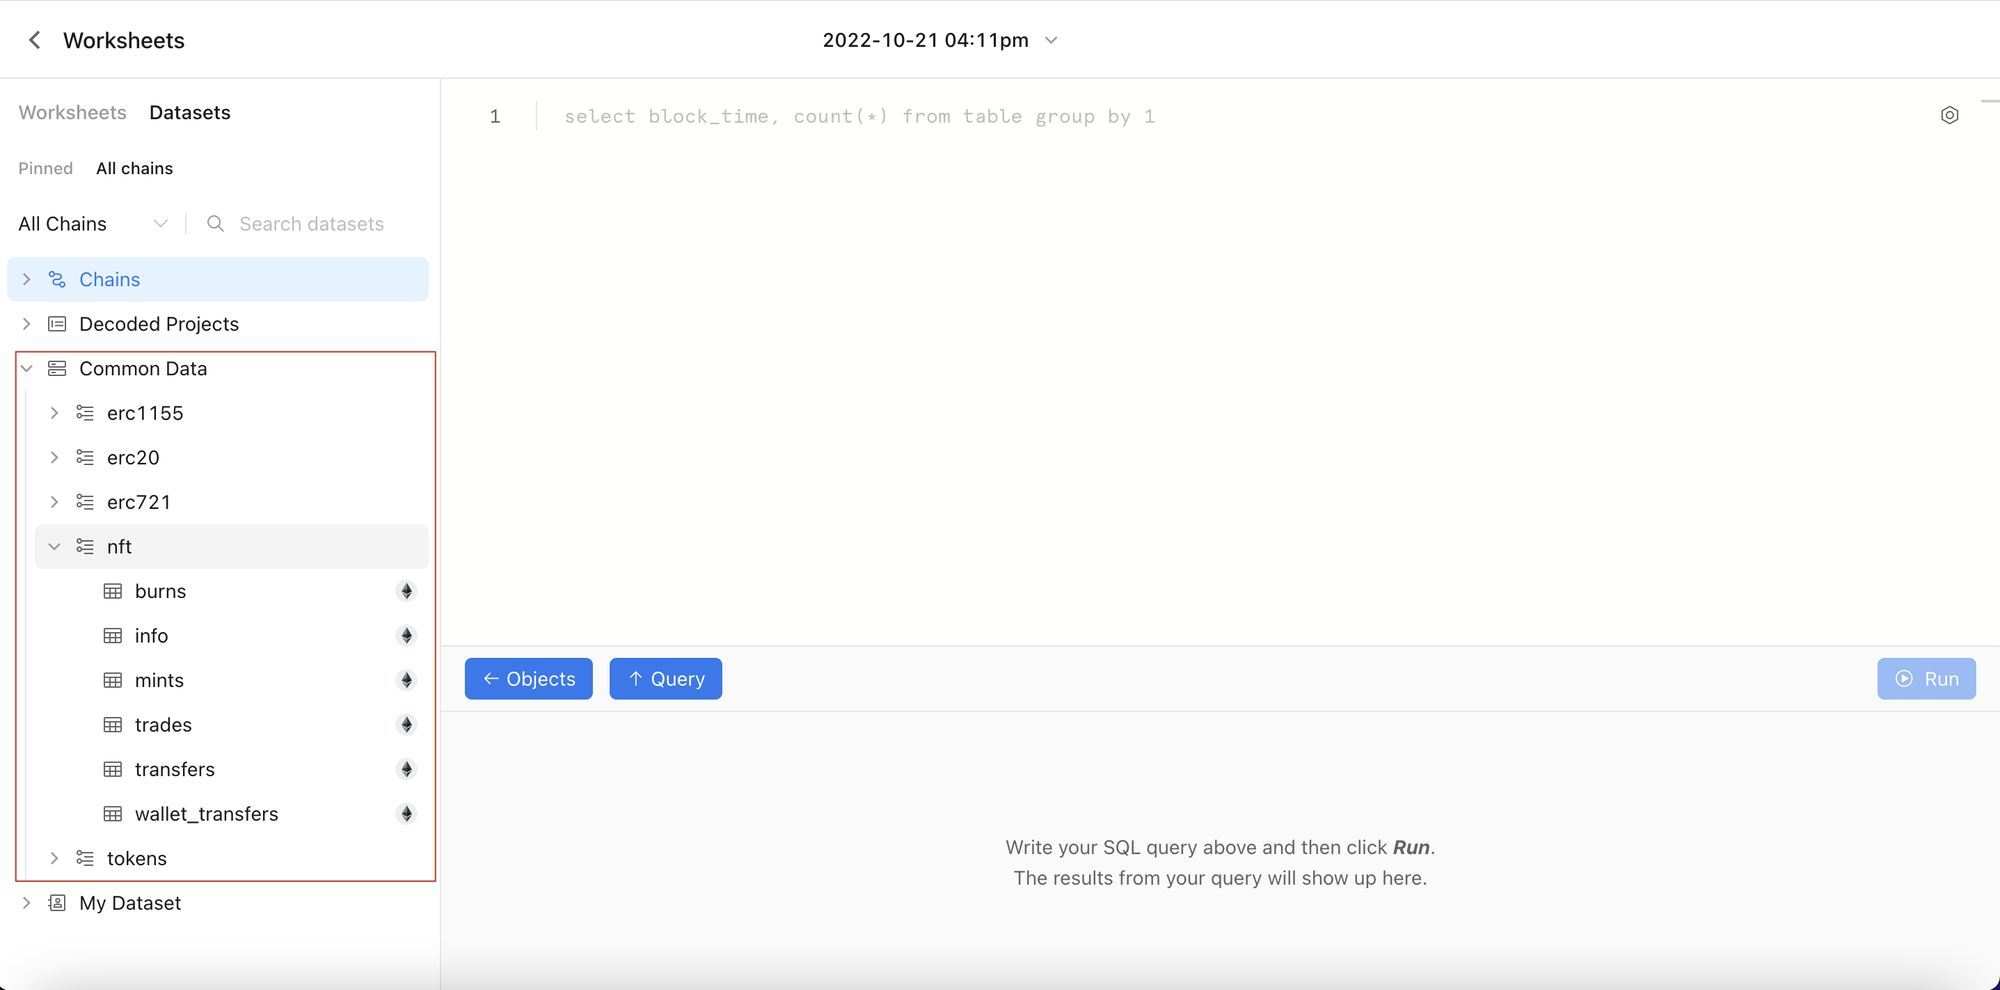
- Common Data: Supporting ETL related to the NFT marketplace, such as trades & price
- My Dataset: All the tables submitted by the user can be viewed in the My Dataset
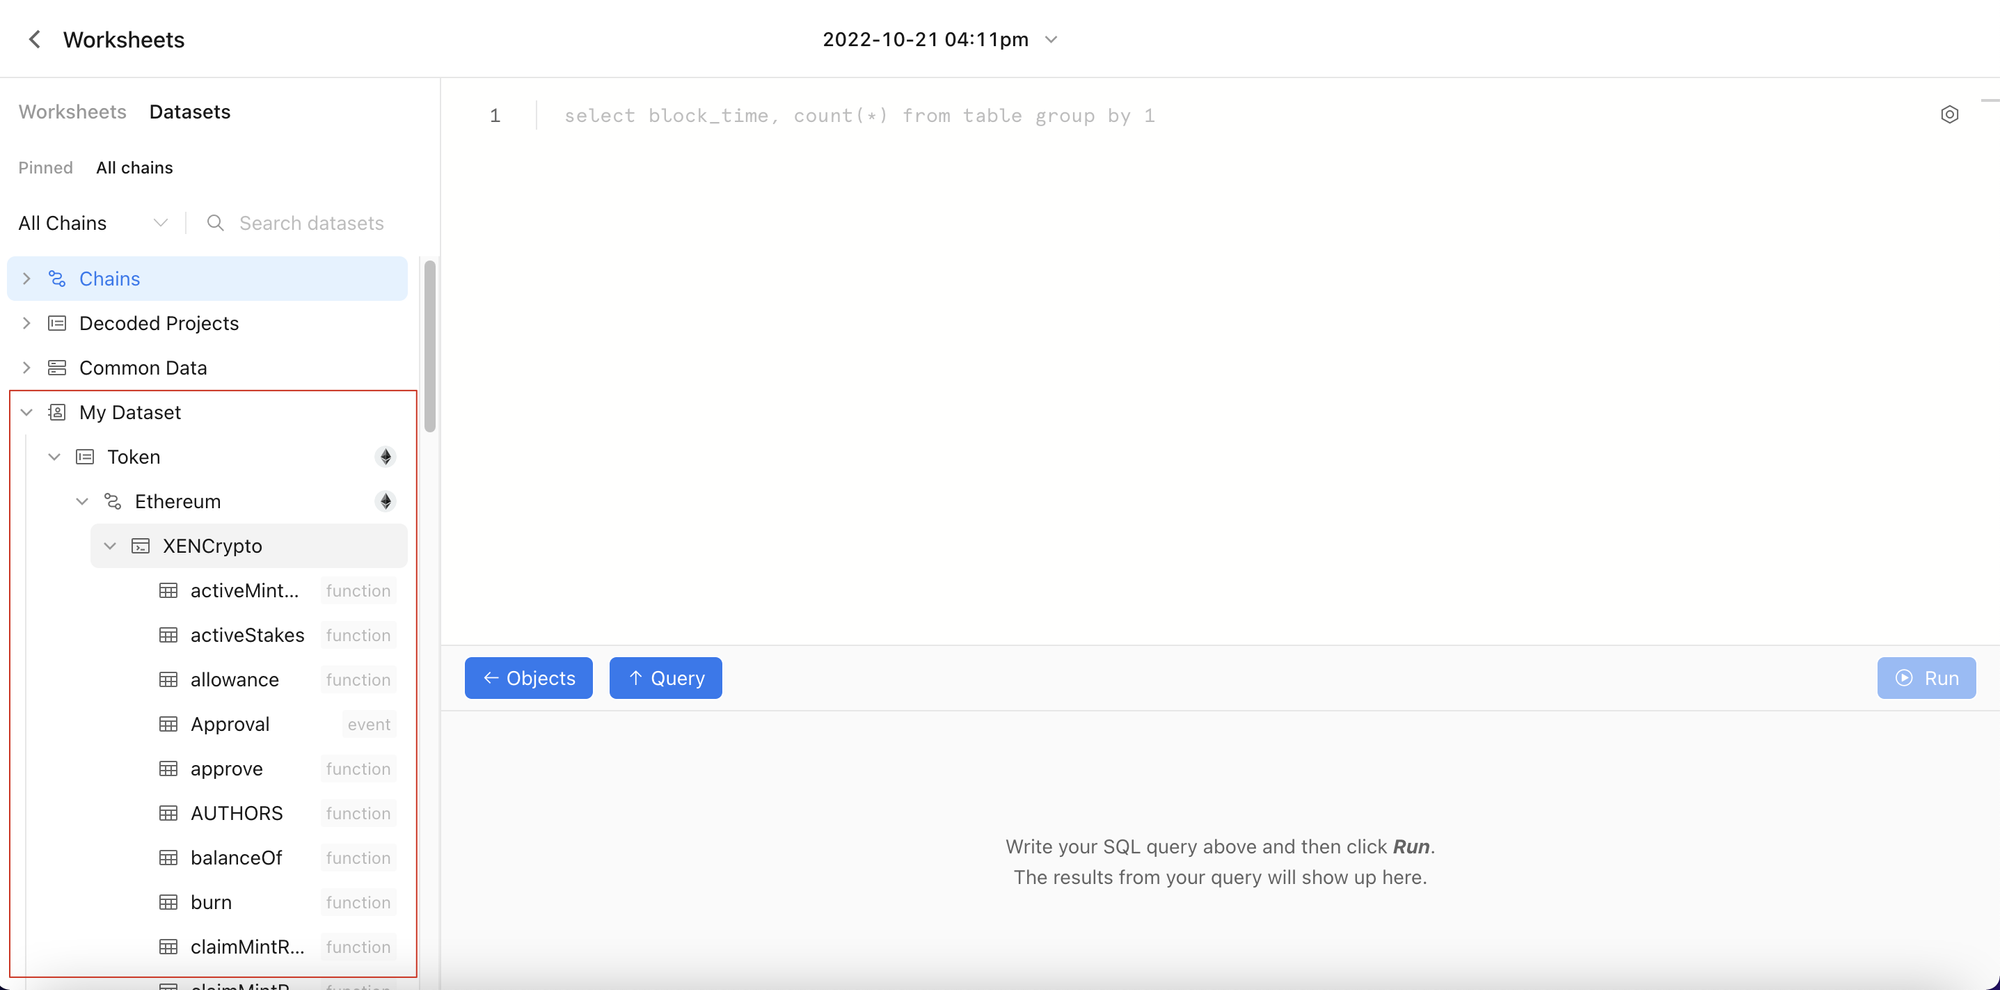
- Double-click the table name or field name to send the corresponding information to the SQL input box
SQL Input Box
- Support Spark SQL
- Support SQL layout in one click (Format)
- Support light/dark mode
Result & Chart
Result
- Click run ( or ctrl+enter ) to view the execution progress
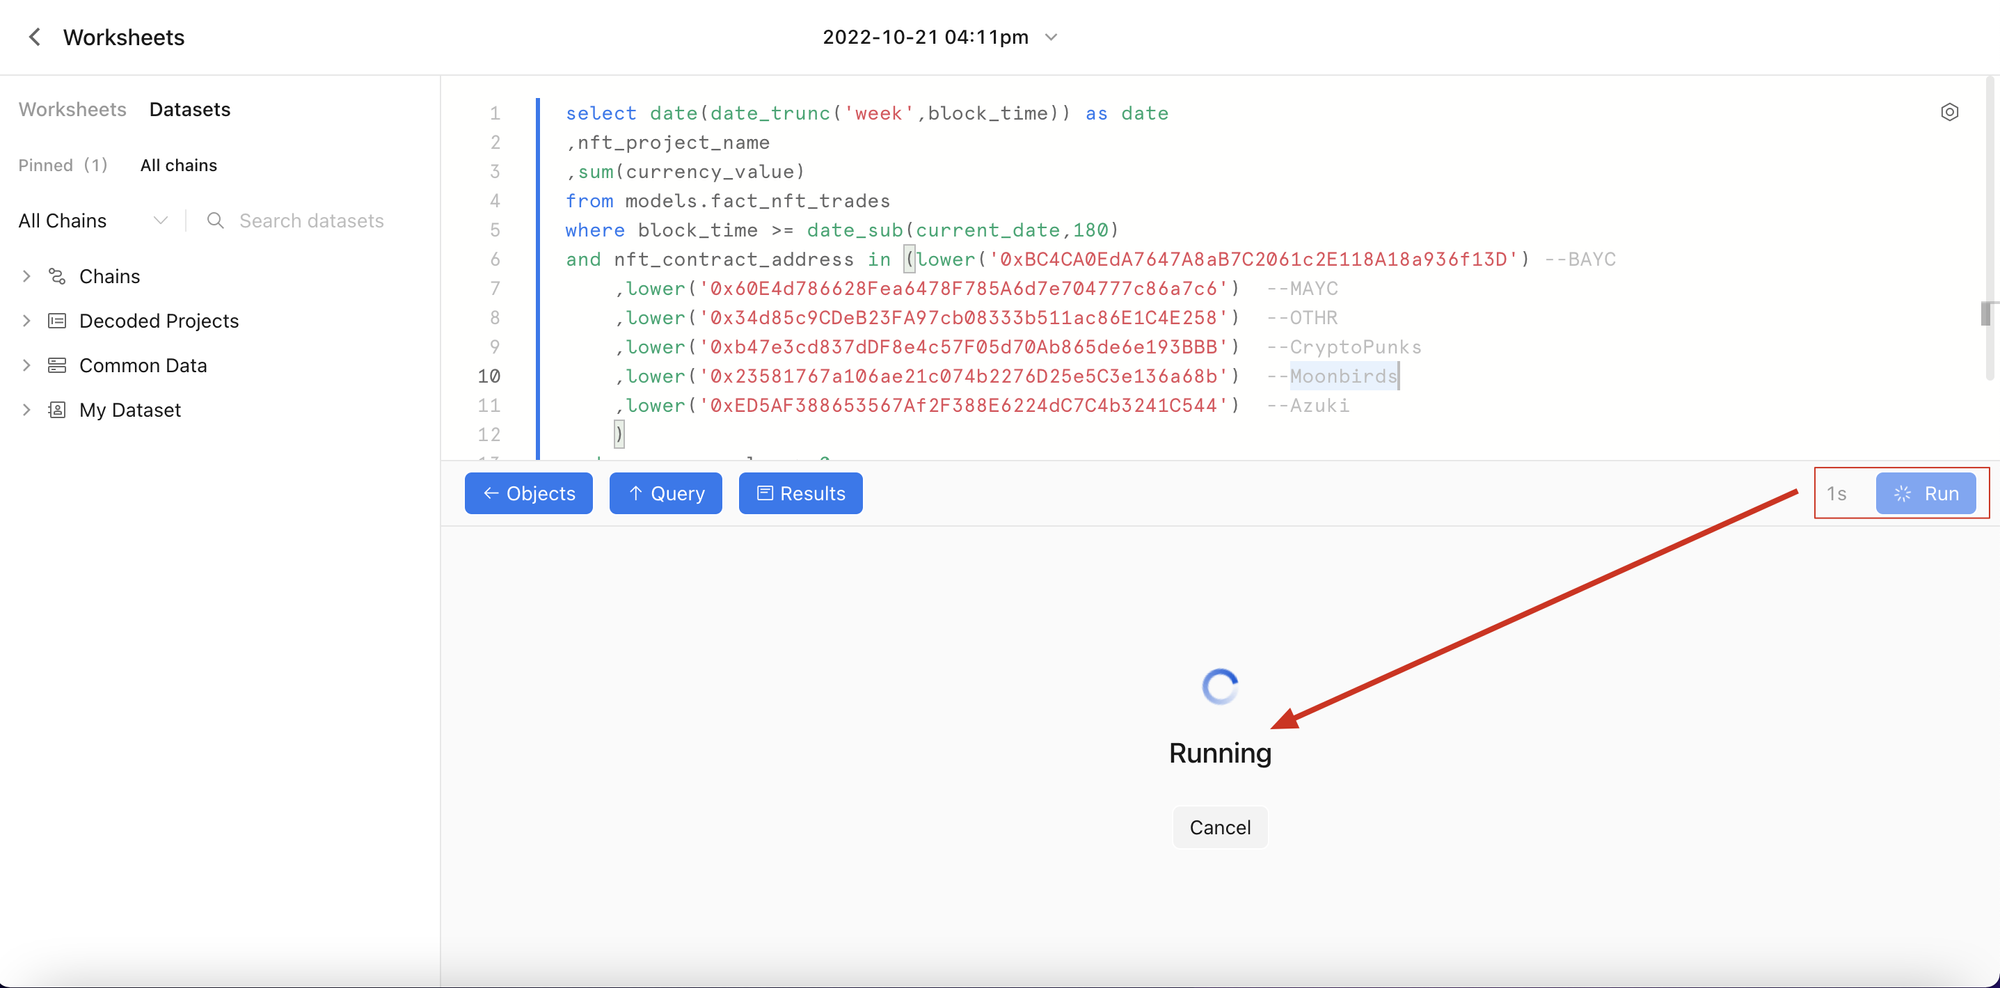
- The data will be displayed in the resulting command if the query succeeds.
- Data Results can be downloaded in CSV format.
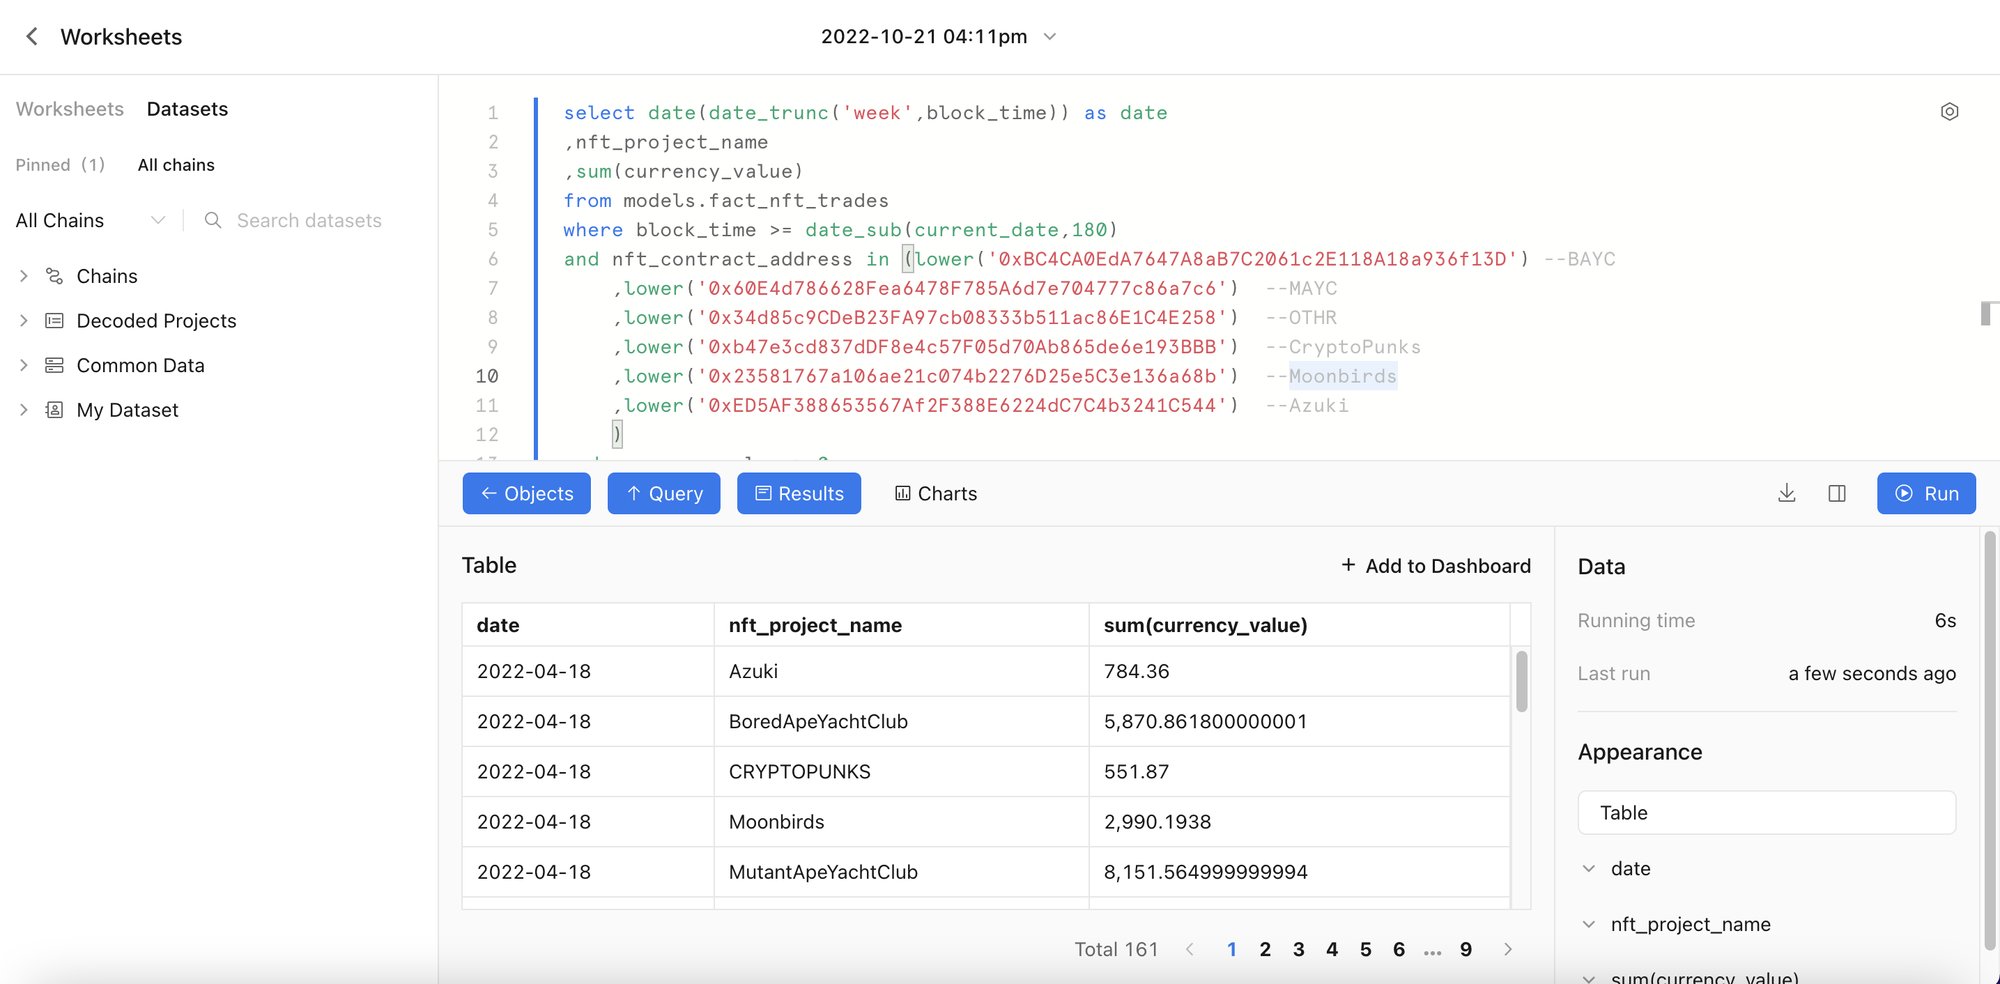
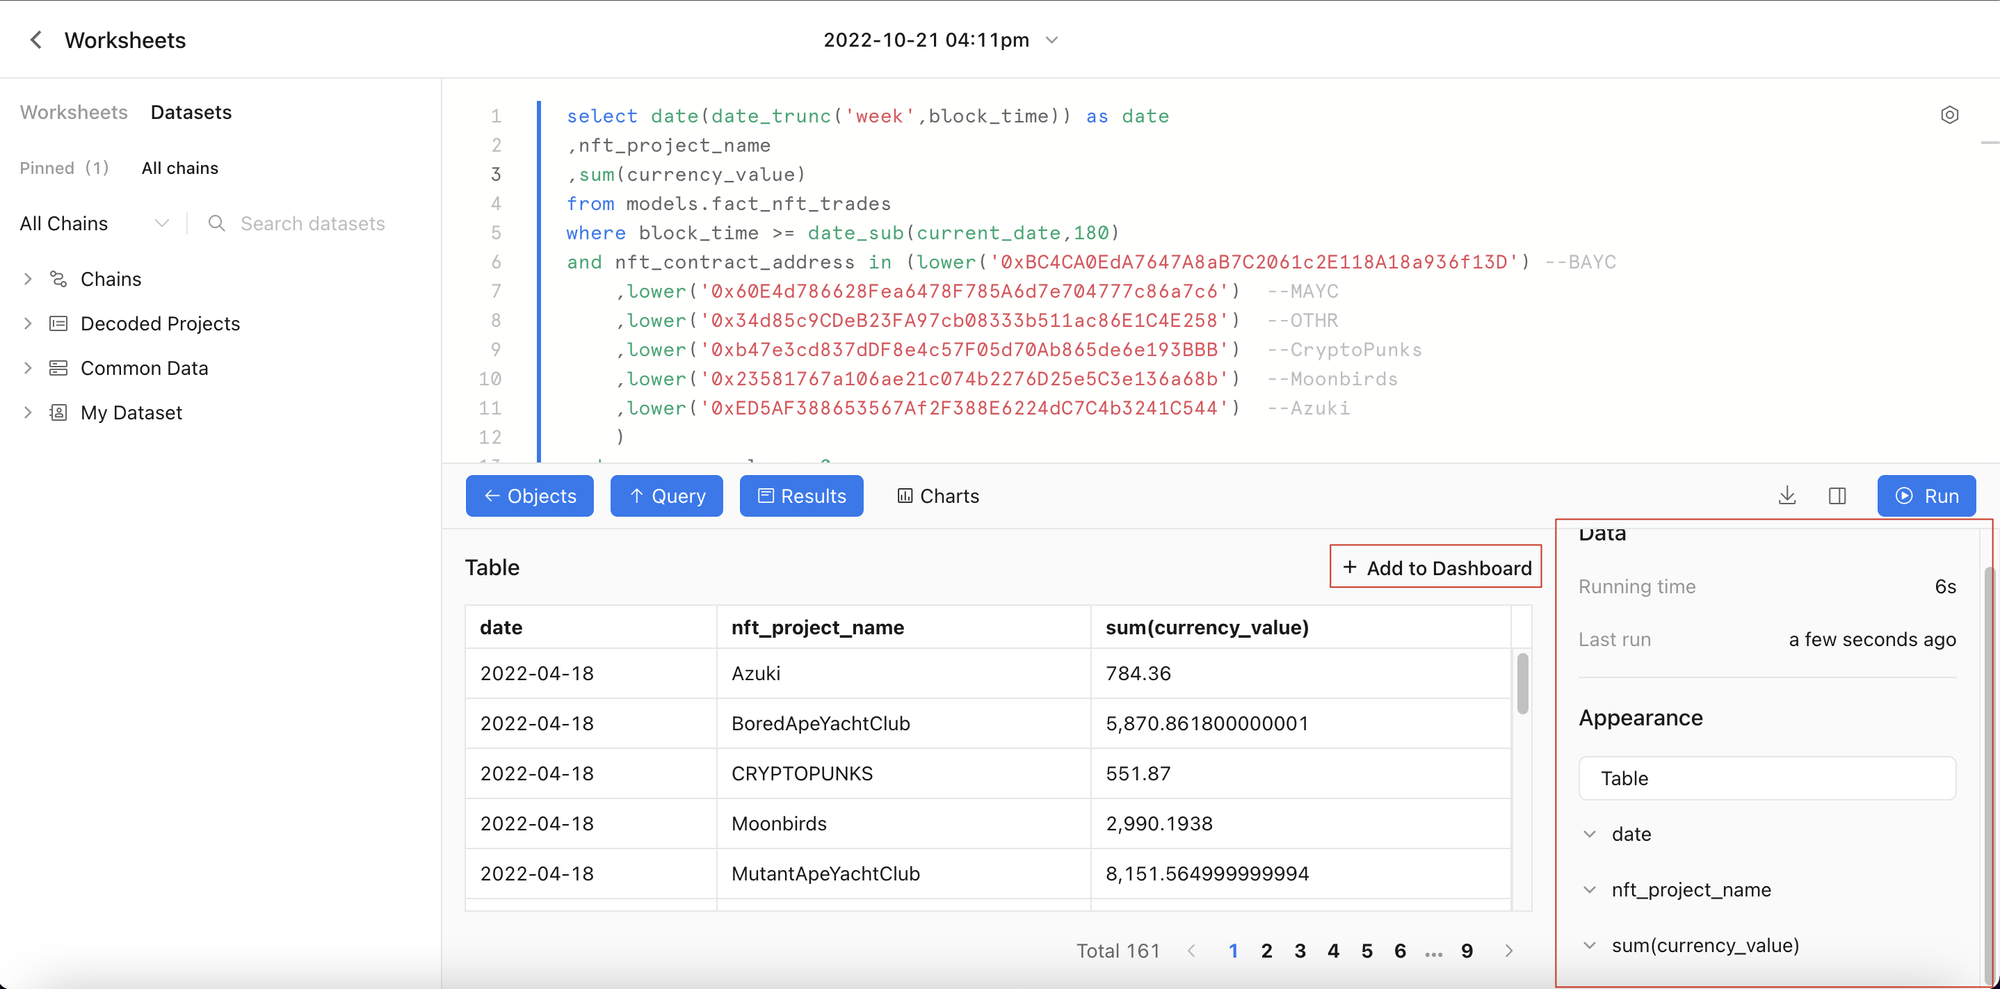
- The results can be added to the Dashboard.
Configuration items:
- Displays the execution time for SQL
- Time of the last execution
- Adjustable table Title, field name, decimal place, thousandth place, etc
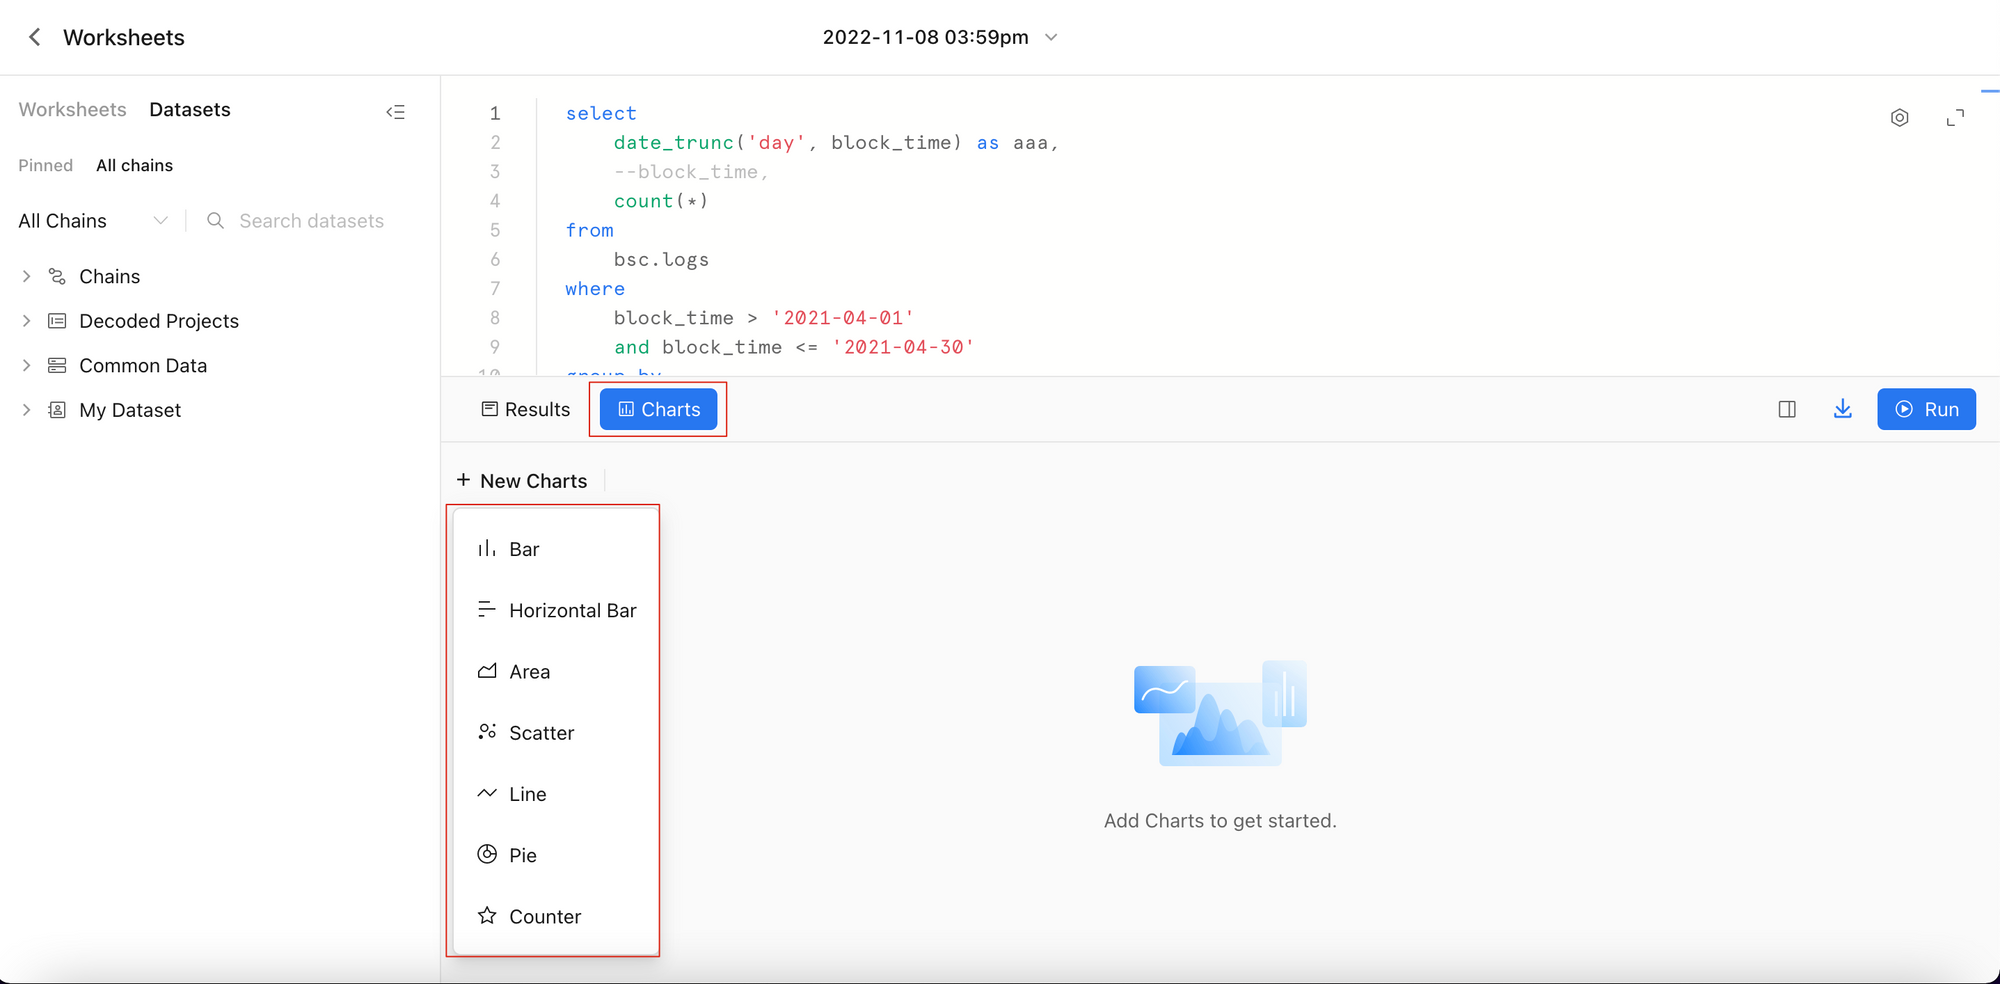
Chart
- Support charts such as Bar, Horizontal Bar, Area, Scatter, Line, Pie and Counter
Example: Bar Chart
- Click on Chart Type to quickly switch the chart type (Bar, Area, Scatter, Line)
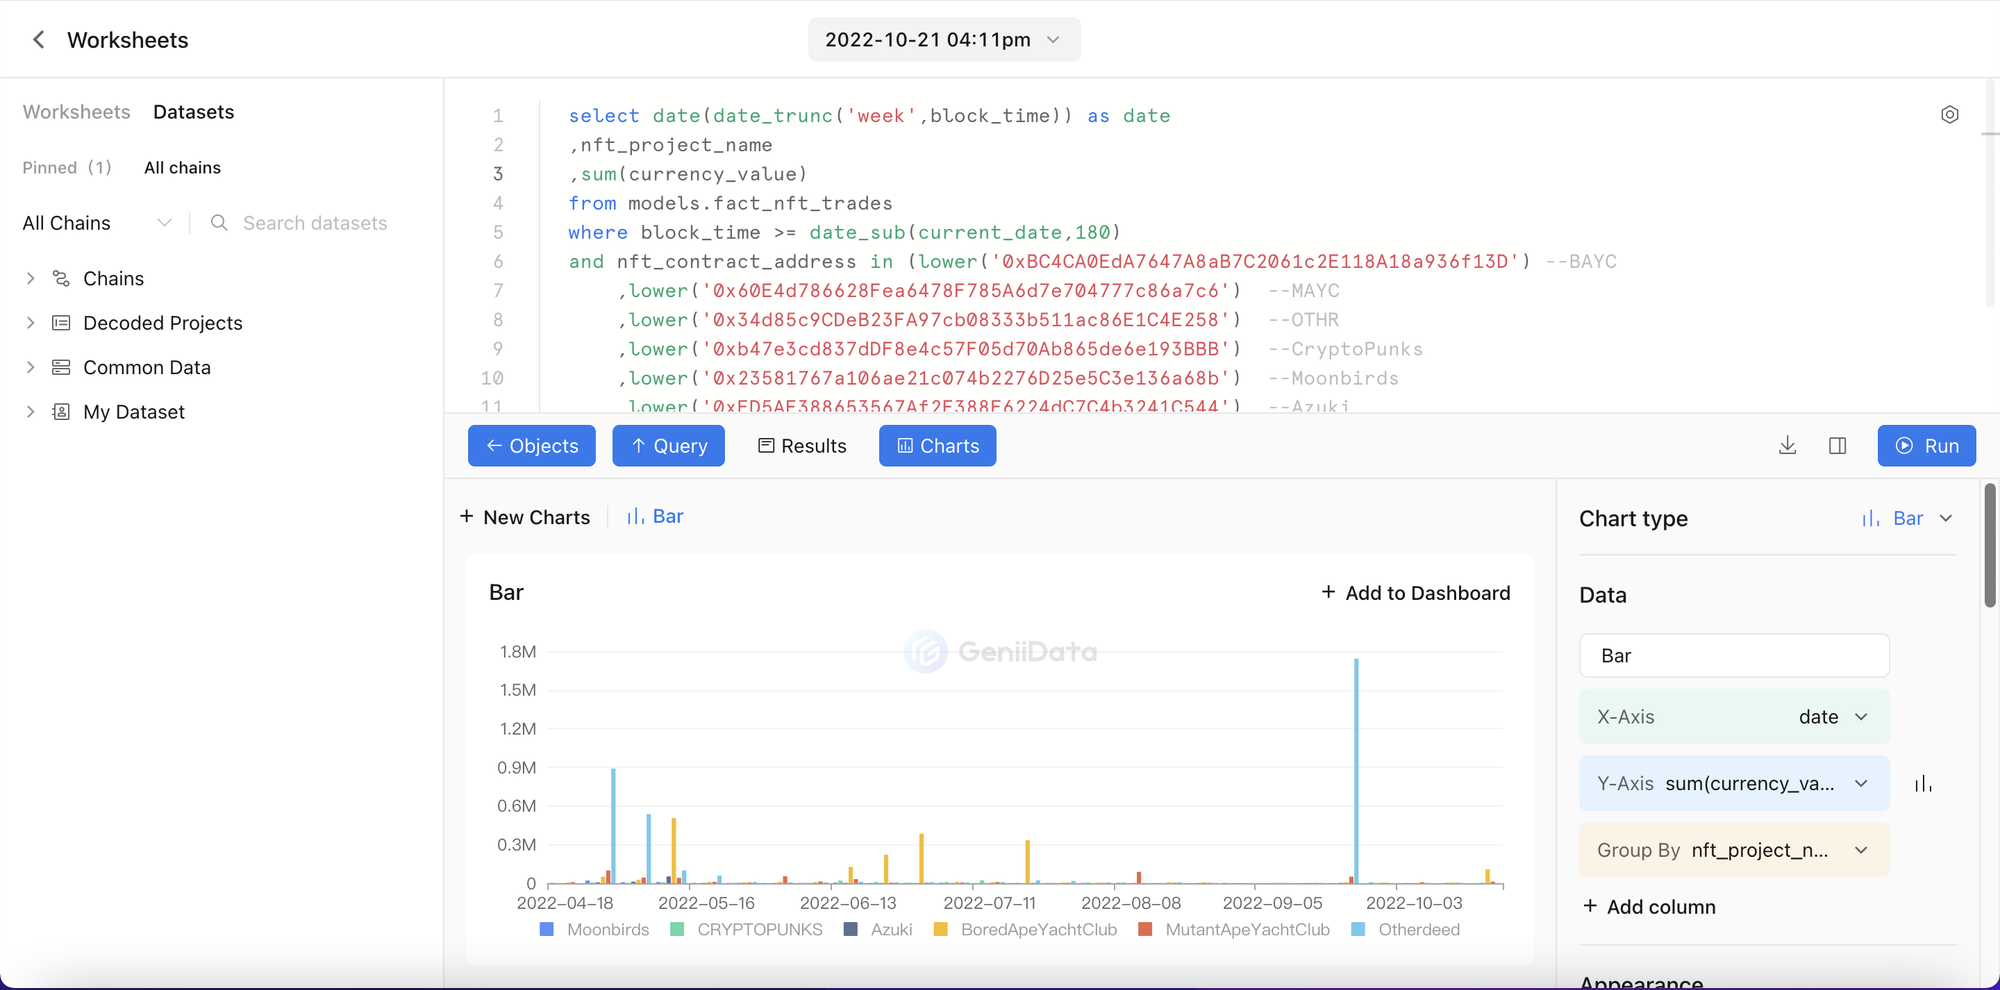
- The chart can be quickly added to the Dashboard.
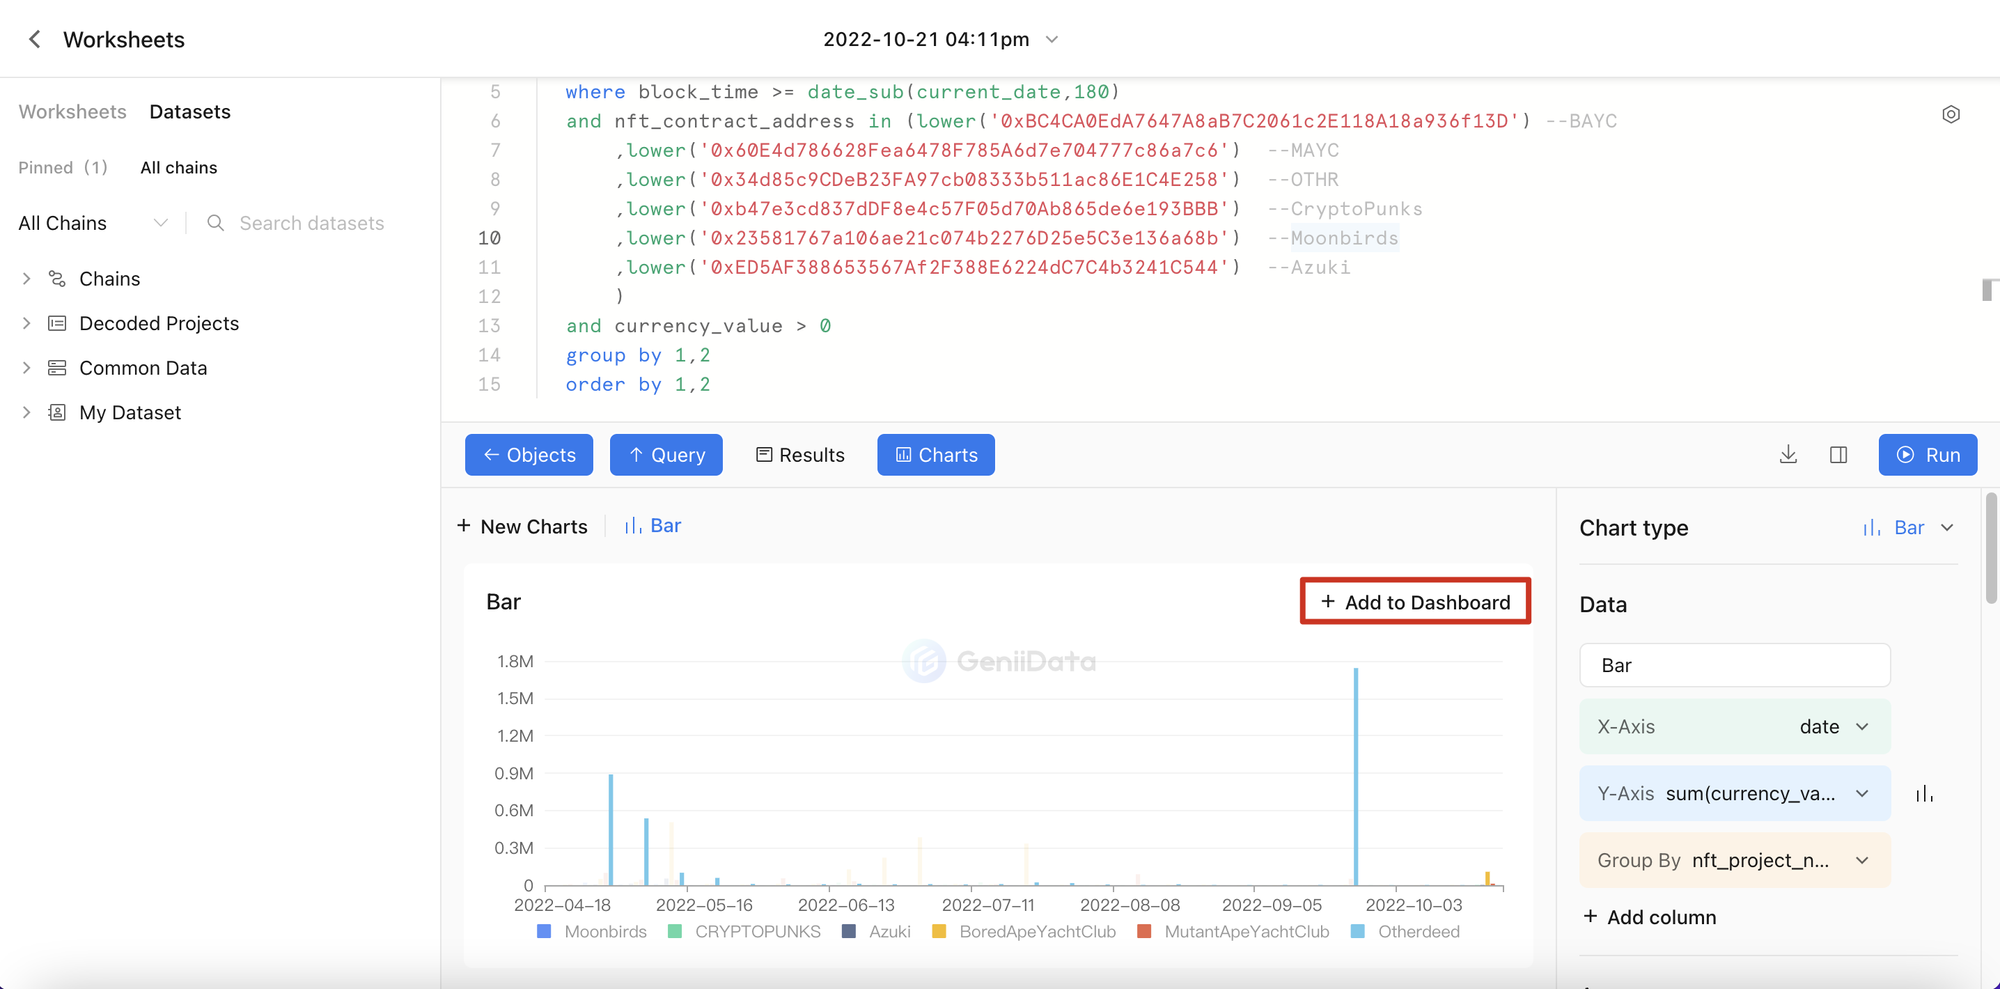
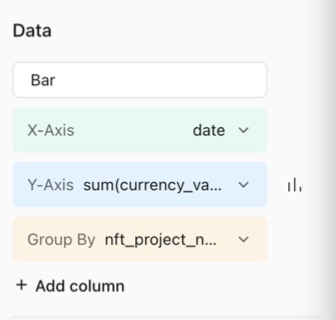
- Data
- Support adjusting chart names
- X-axis and Y-axis are mandatory, and multiple columns can be added to the Y-axis (click on +Add column)
- Group by (optional)
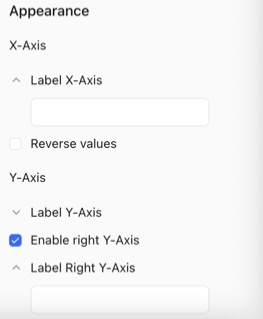
- Appearance
- X-axis or Y-axis names can be added.
- The X-axis is in reverse order. By default, the data is in positive order.
- Enabling Right Y-axis
- Double Y-axis
- Line and column mix data
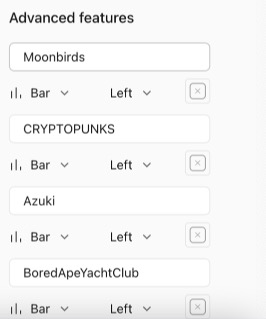
- Advanced features
- Support changing indicator names and graphs
- Supports alignment adjustment (left alignment by default). If you select the right alignment, the right Y-axis will be enabled first.
- Support changing the indicator color
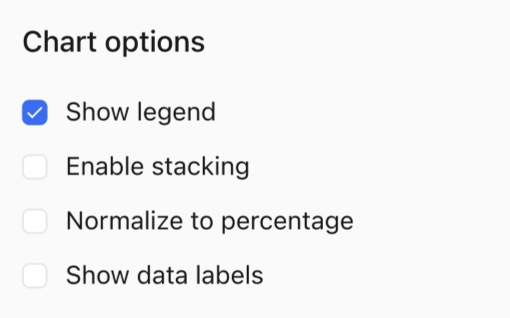
- Chart options
- Show Legend is opened by default.
- Enable stacking, Normalize to percentage, and Show data labels are closed by default
- Delete Chart
- Users can delete charts at the end of the configuration items.
- Double confirmation is required when deleting the chart
- Note: If the chart is referenced by the Dashboard, it cannot be deleted. It can be deleted only after Chart is unbound from the Dashboard.
- following the path by clicking"Worksheets"->"Chart" -> "Add to dashboards"
- Users can delete charts at the end of the configuration items.
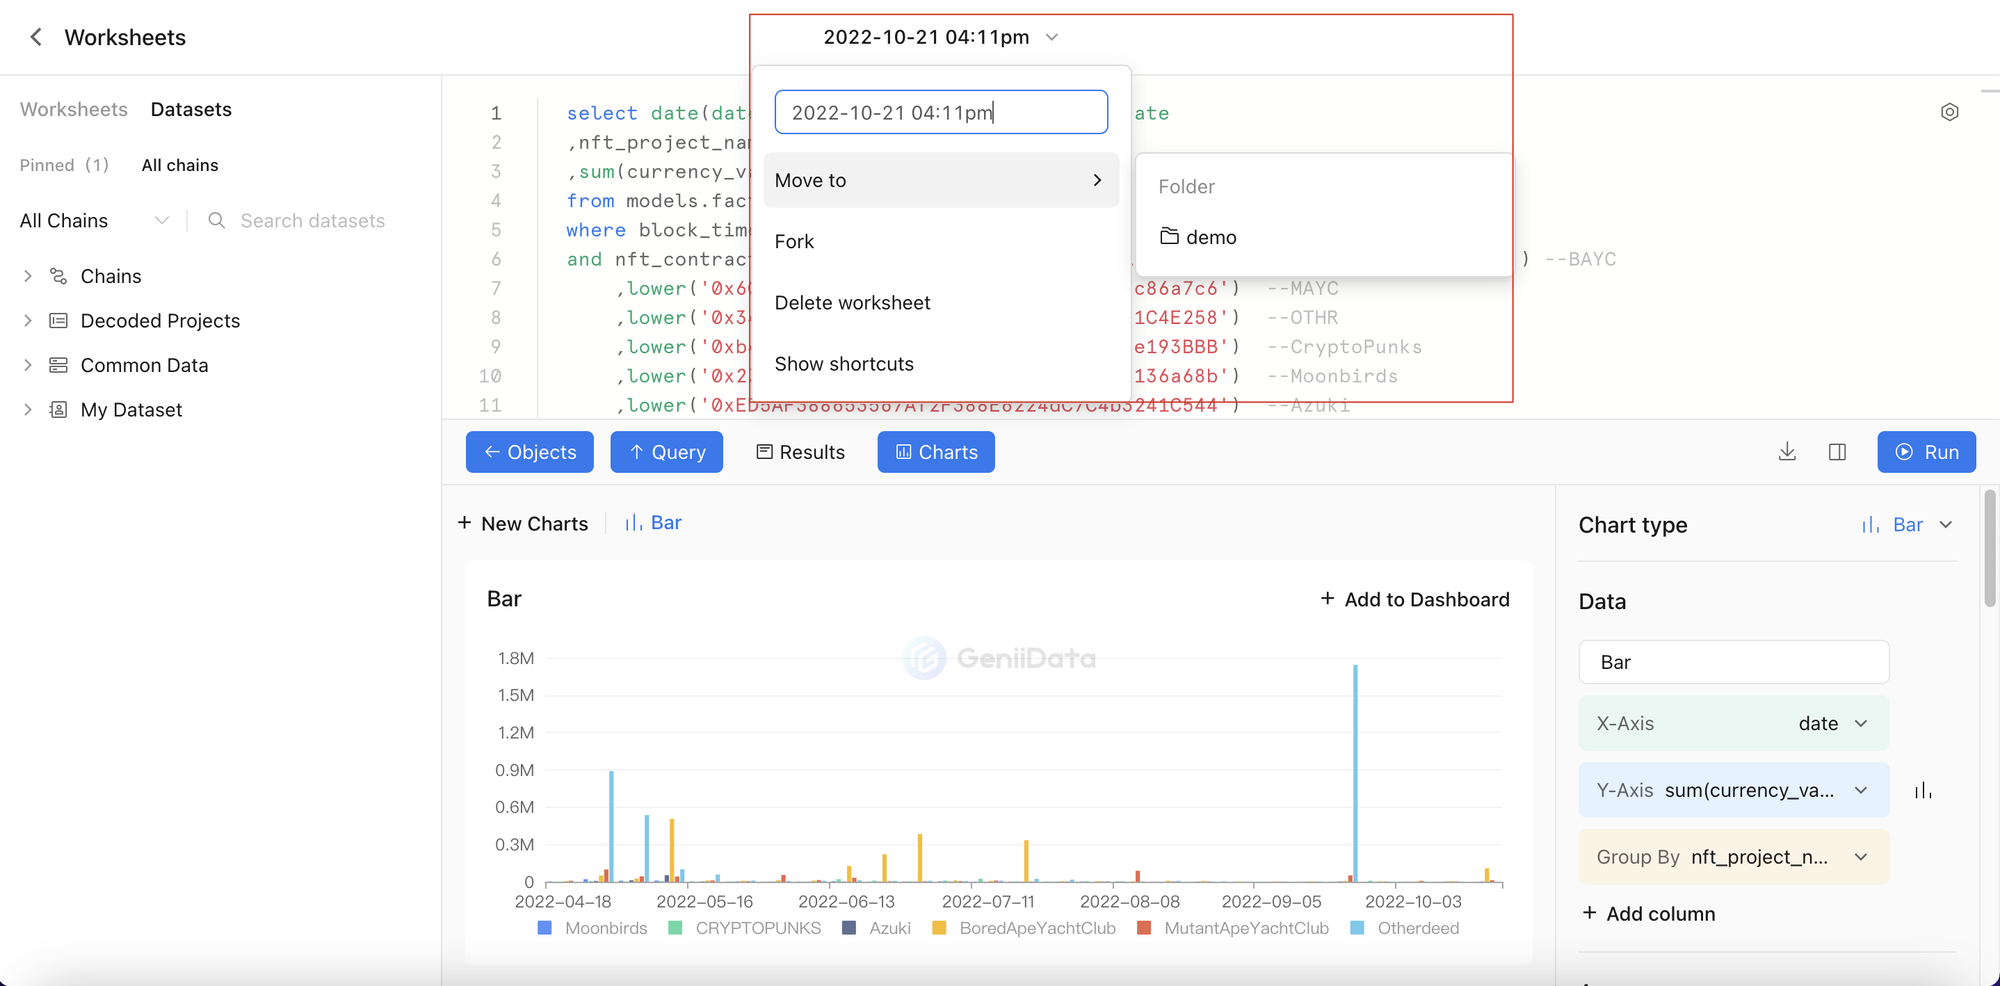
Worksheets Name Drop-down List
- Support adjusting the name of the worksheet
- Quickly moving worksheets into folders.
- Support replicating the current worksheets
- Support deleting worksheets. Double confirmation is required when deleting.
- Displaying
- Command/Ctrl + Ente — Run query
- ⌘ + shift + O / ctrl + alt + O — Format query